The market is booming.
My plan is to buy a small amount every week, but it’s scary to add here. Maybe this is the top.
Or, maybe we under estimate the scale of what’s happening and the S&P is going to $10,000.
I put together our monthly Killer Chart pack (link to the full slide deck below), and as I was going over the slides, it painted the picture of a market which can go higher.
Let me explain.
10 slides which suggest the market can go higher.
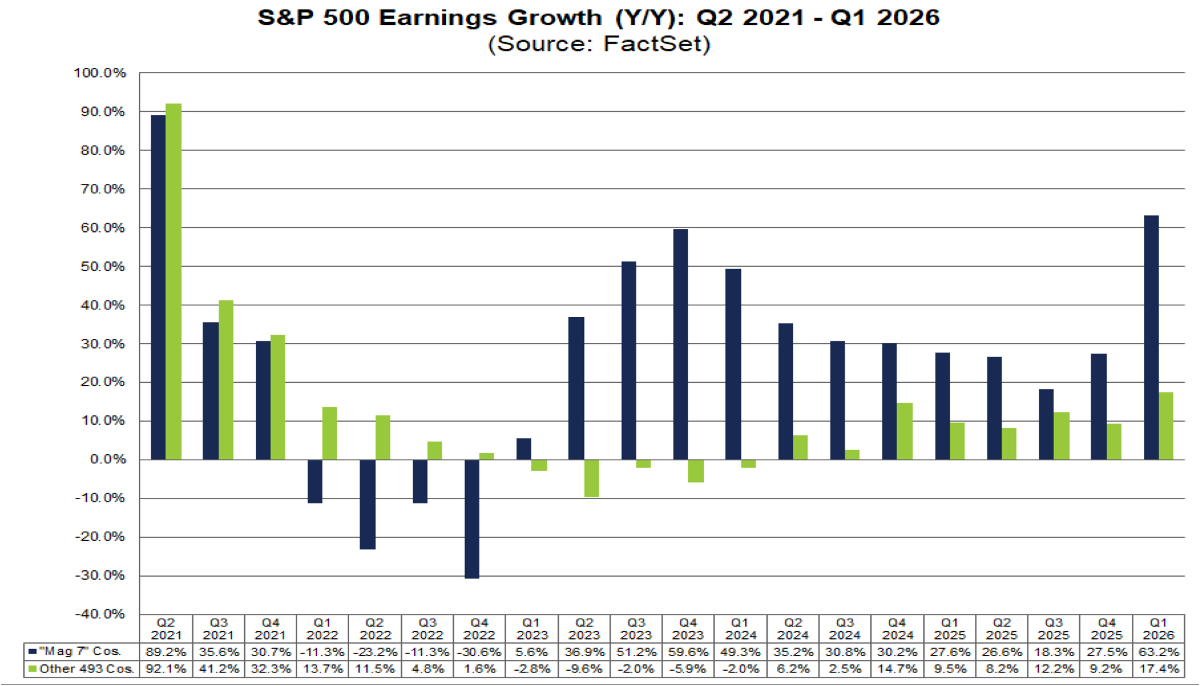
#1 Everyone is talking about MAG7, but the other 493 stocks are really starting to pick up too. The boom we’ve been talking about is widening out. Earnings for the ‘493’ grew 17% in Q1.
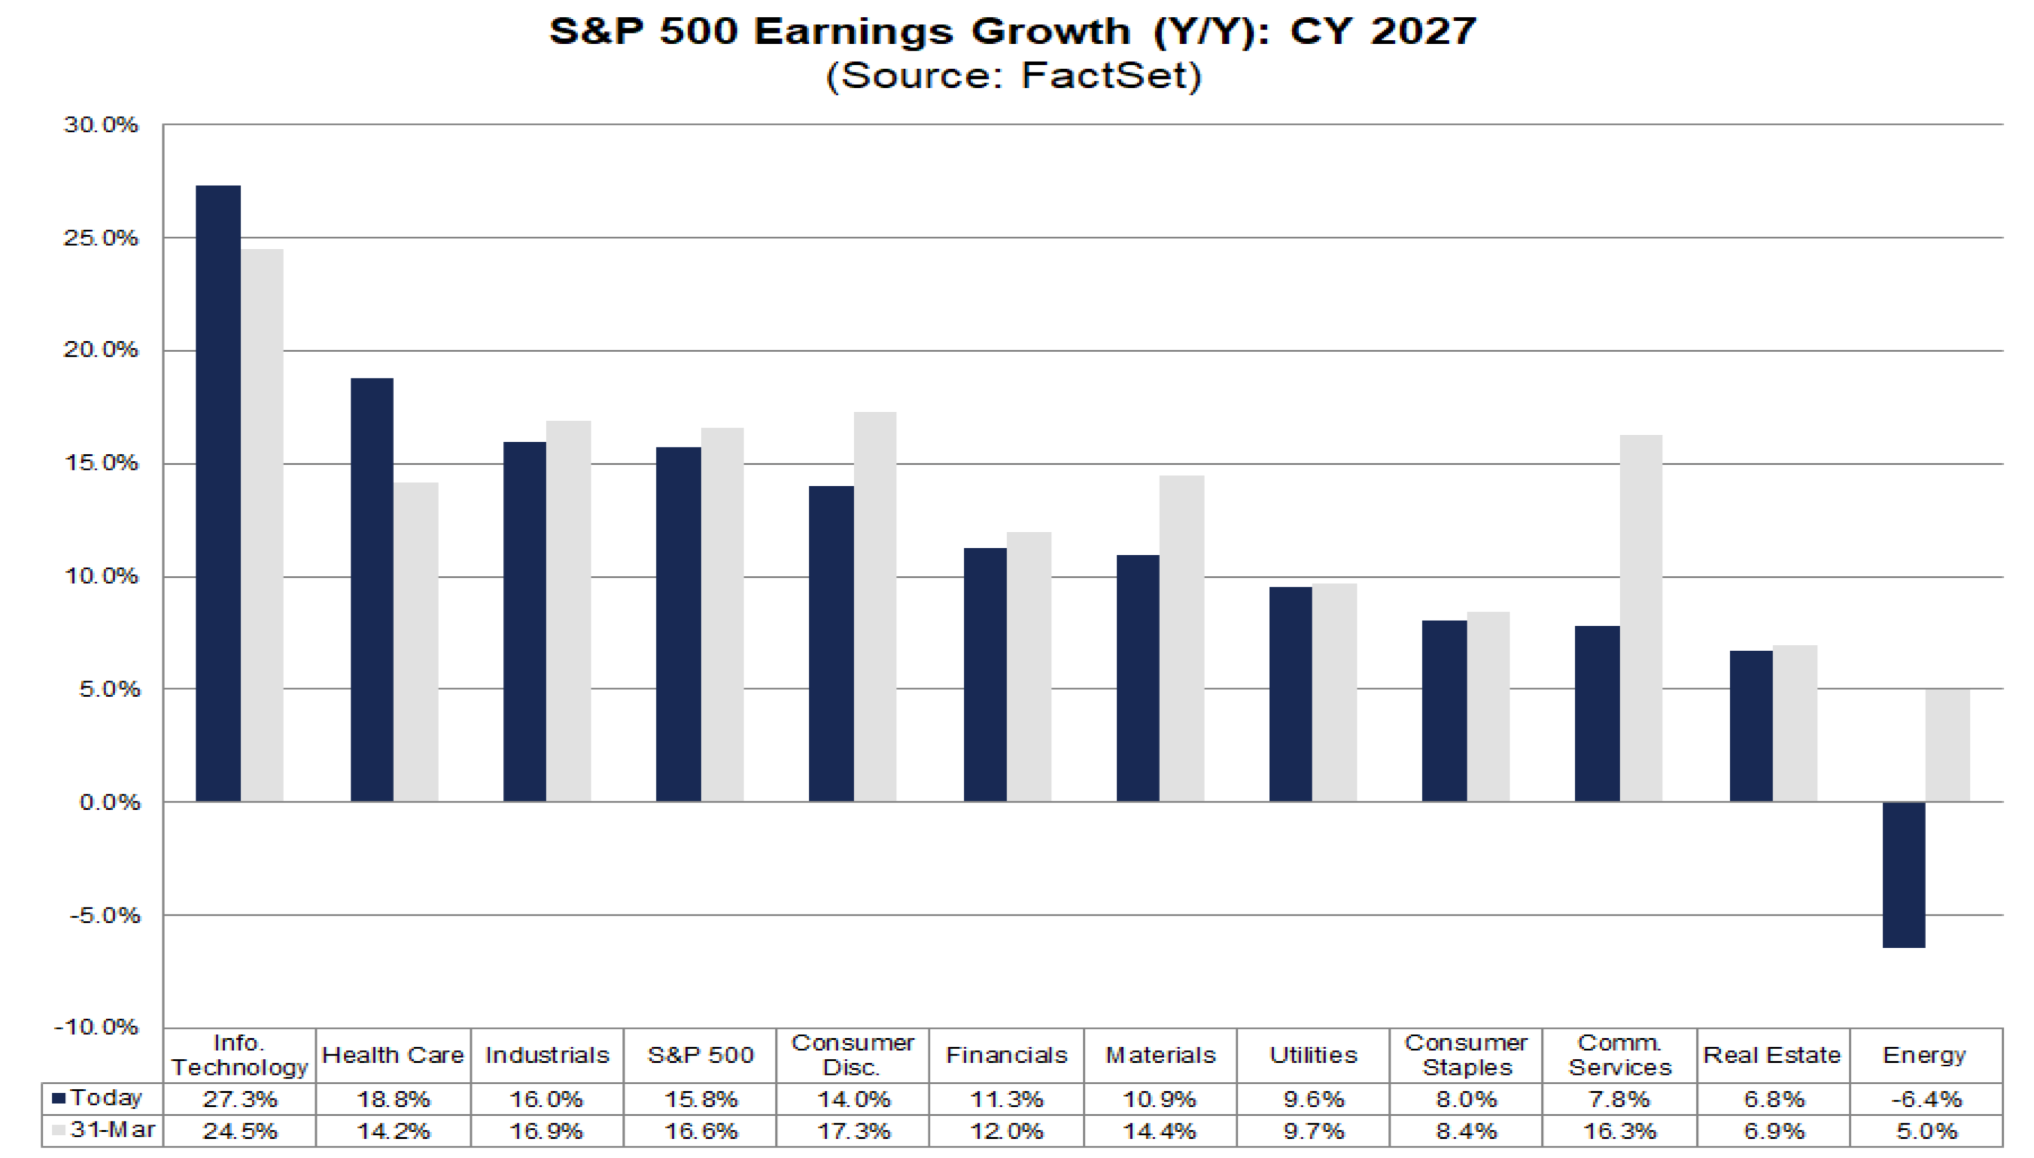
#2 EPS estimates keep getting revised higher and assumptions for 2027 might be conservative. In 2027 Info Tech is supposed to growth +25% (compared to +40%) in 2026, but energy earnings are supposed to decline 6%. That looks wrong. Energy has been a top growth surprise in 2026 (along with memory) and looks set up to surprise again in 2027.
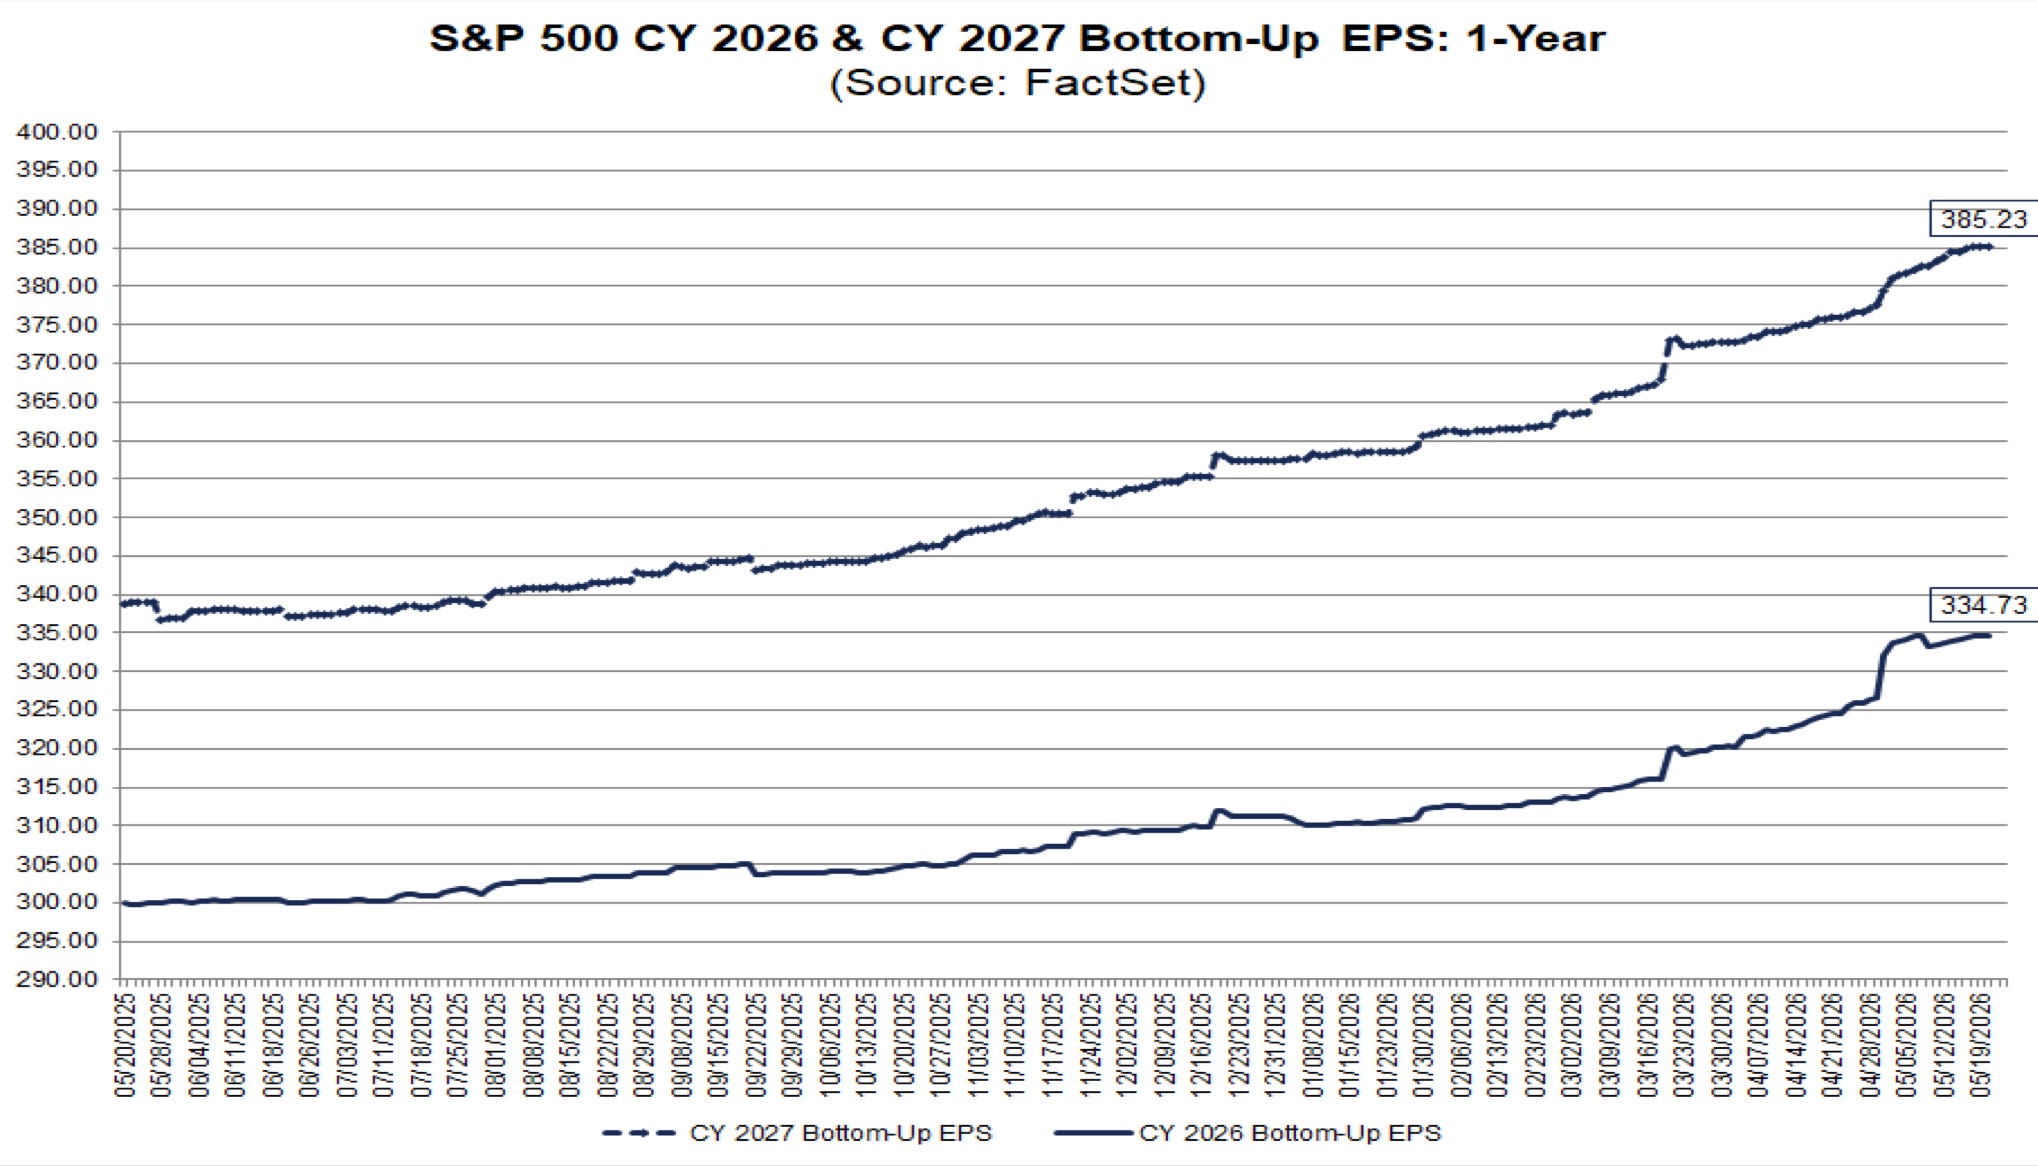
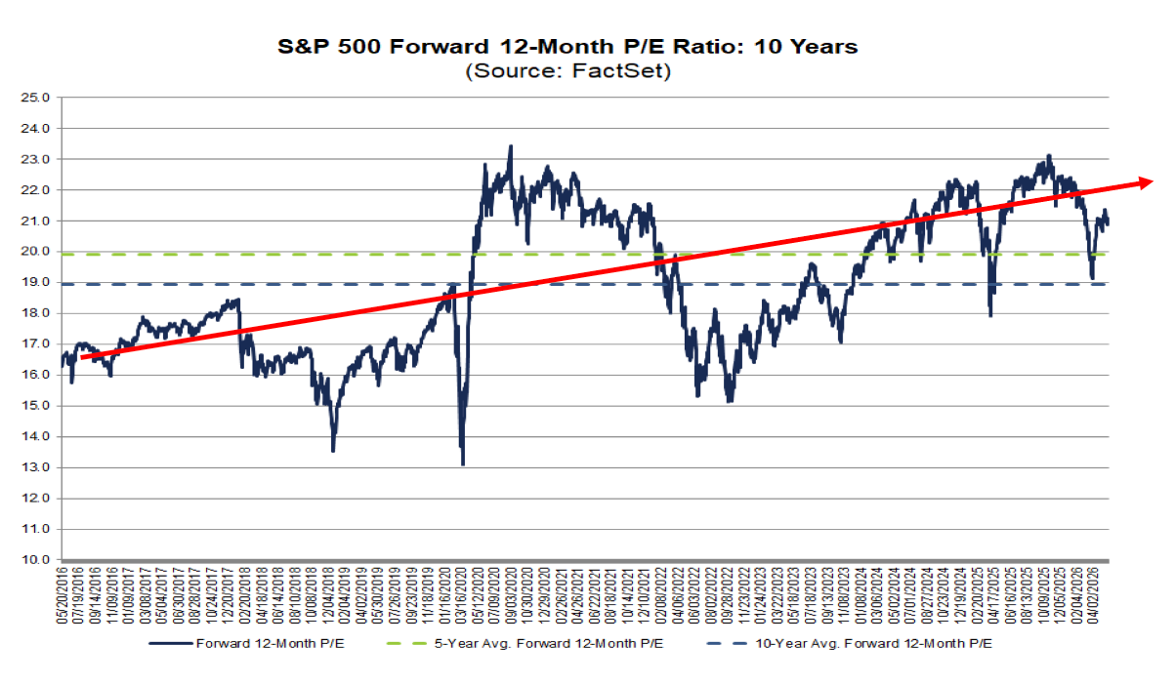
#3 The S&P is rerating to 25x. Fiddle around with your Gordon Growth model and tell me the right P/E for an index growing earnings consistently at +10%/yr over decades with a risk free rate of 4%? It’s a really high number. We are fighting it, but I think the S&P wants to trade at 25x. 25x on a $400 EPS and we have S&P $10,000.
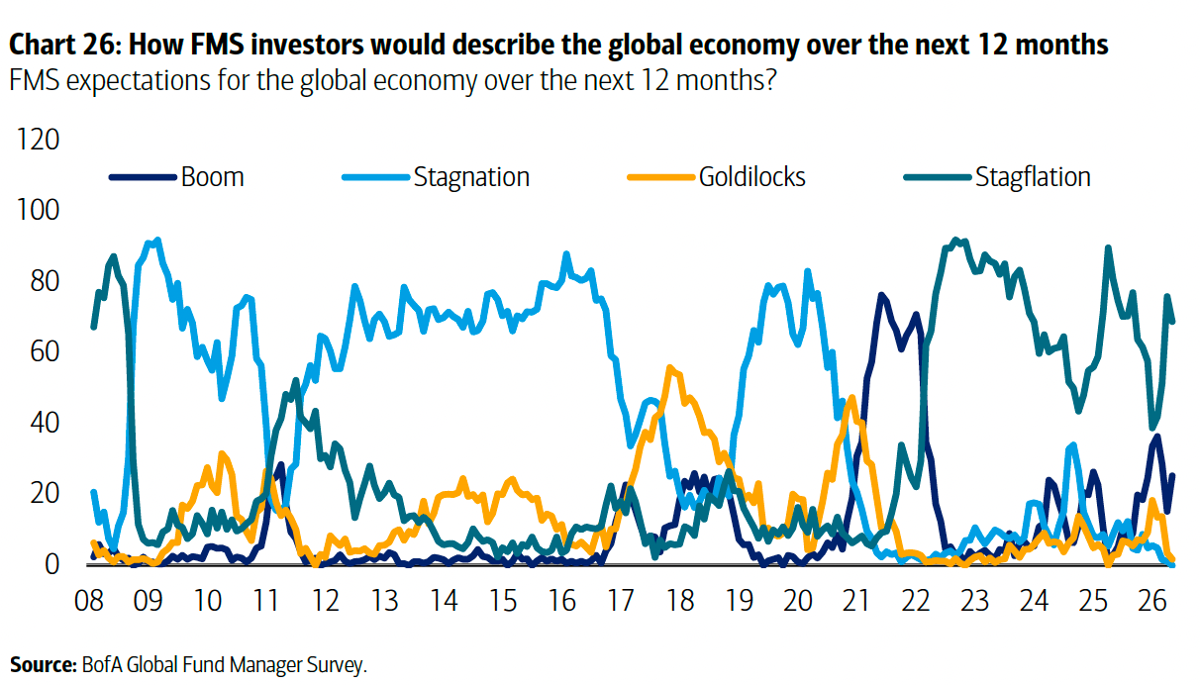
#4 Investors don’t see the boom underway. They think it is stagflation. They don’t see the triple layered boom. That skepticism is bullish.
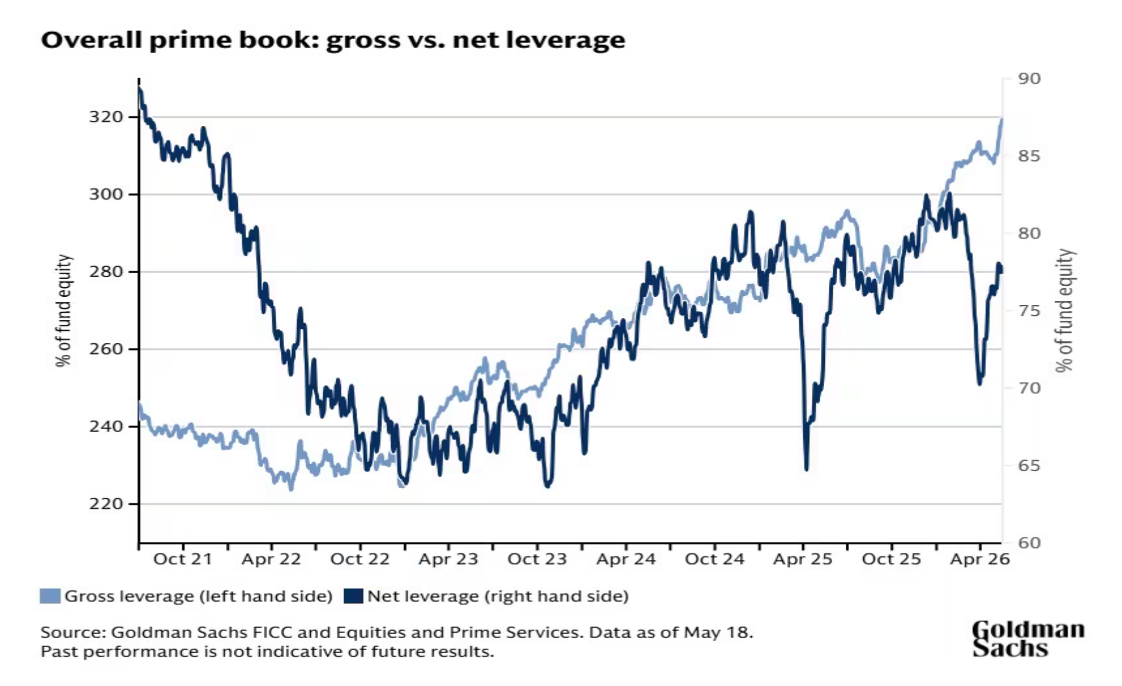
#5 Hedge funds aren’t overly bullish. Unlike in 2021 when net exposure got to 85%. Hedge fund net exposure is at 77%. Above average, but not extreme. They are nervous about the direction of the market and prefer to make their money through long/short bets with high gross. This is a positive sign. They aren’t getting carried away.