YWR: 15 Charts say the Market goes Higher
Disclosure: These are personal views only. Not investment recommendations or advice. For investment advice please seek professional help.
Everyone’s rattled by the sell-off.
Here are 15 charts which suggest the outlook for equities is bullish.
CNN Greed & Fear is at extreme fear. You’re scared? So is everyone. You’re consensus.
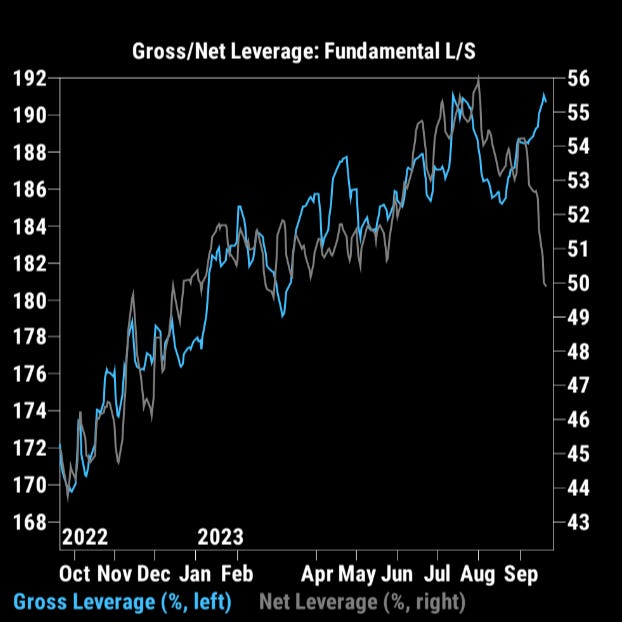
Hedge funds are selling. It’s a good sign when the smartest investors are reducing net exposure (from 55% to 50%).
Short selling at elevated levels.
Even better is when the computers have been selling too and are now net short.
An inverted VIX (1m > 3m) means investors are paying up for protection on near term volatility (1 month). They expect a crash. Usually, this is the sign of a bottom.
Institutional investors can’t imagine the market going up. The last time they were bullish was the short-term top in 2021. Total contrarian indicator.


