
YWR: A Factor Model Mystery!

We have a mystery on our hands.
And everyone loves a good mystery.
Let’s whip through the monthly factor model data and then I’ll get to the big question.
YWR Top 25
When we look at the top 25 ranked stocks it’s a lot of themes we already know.
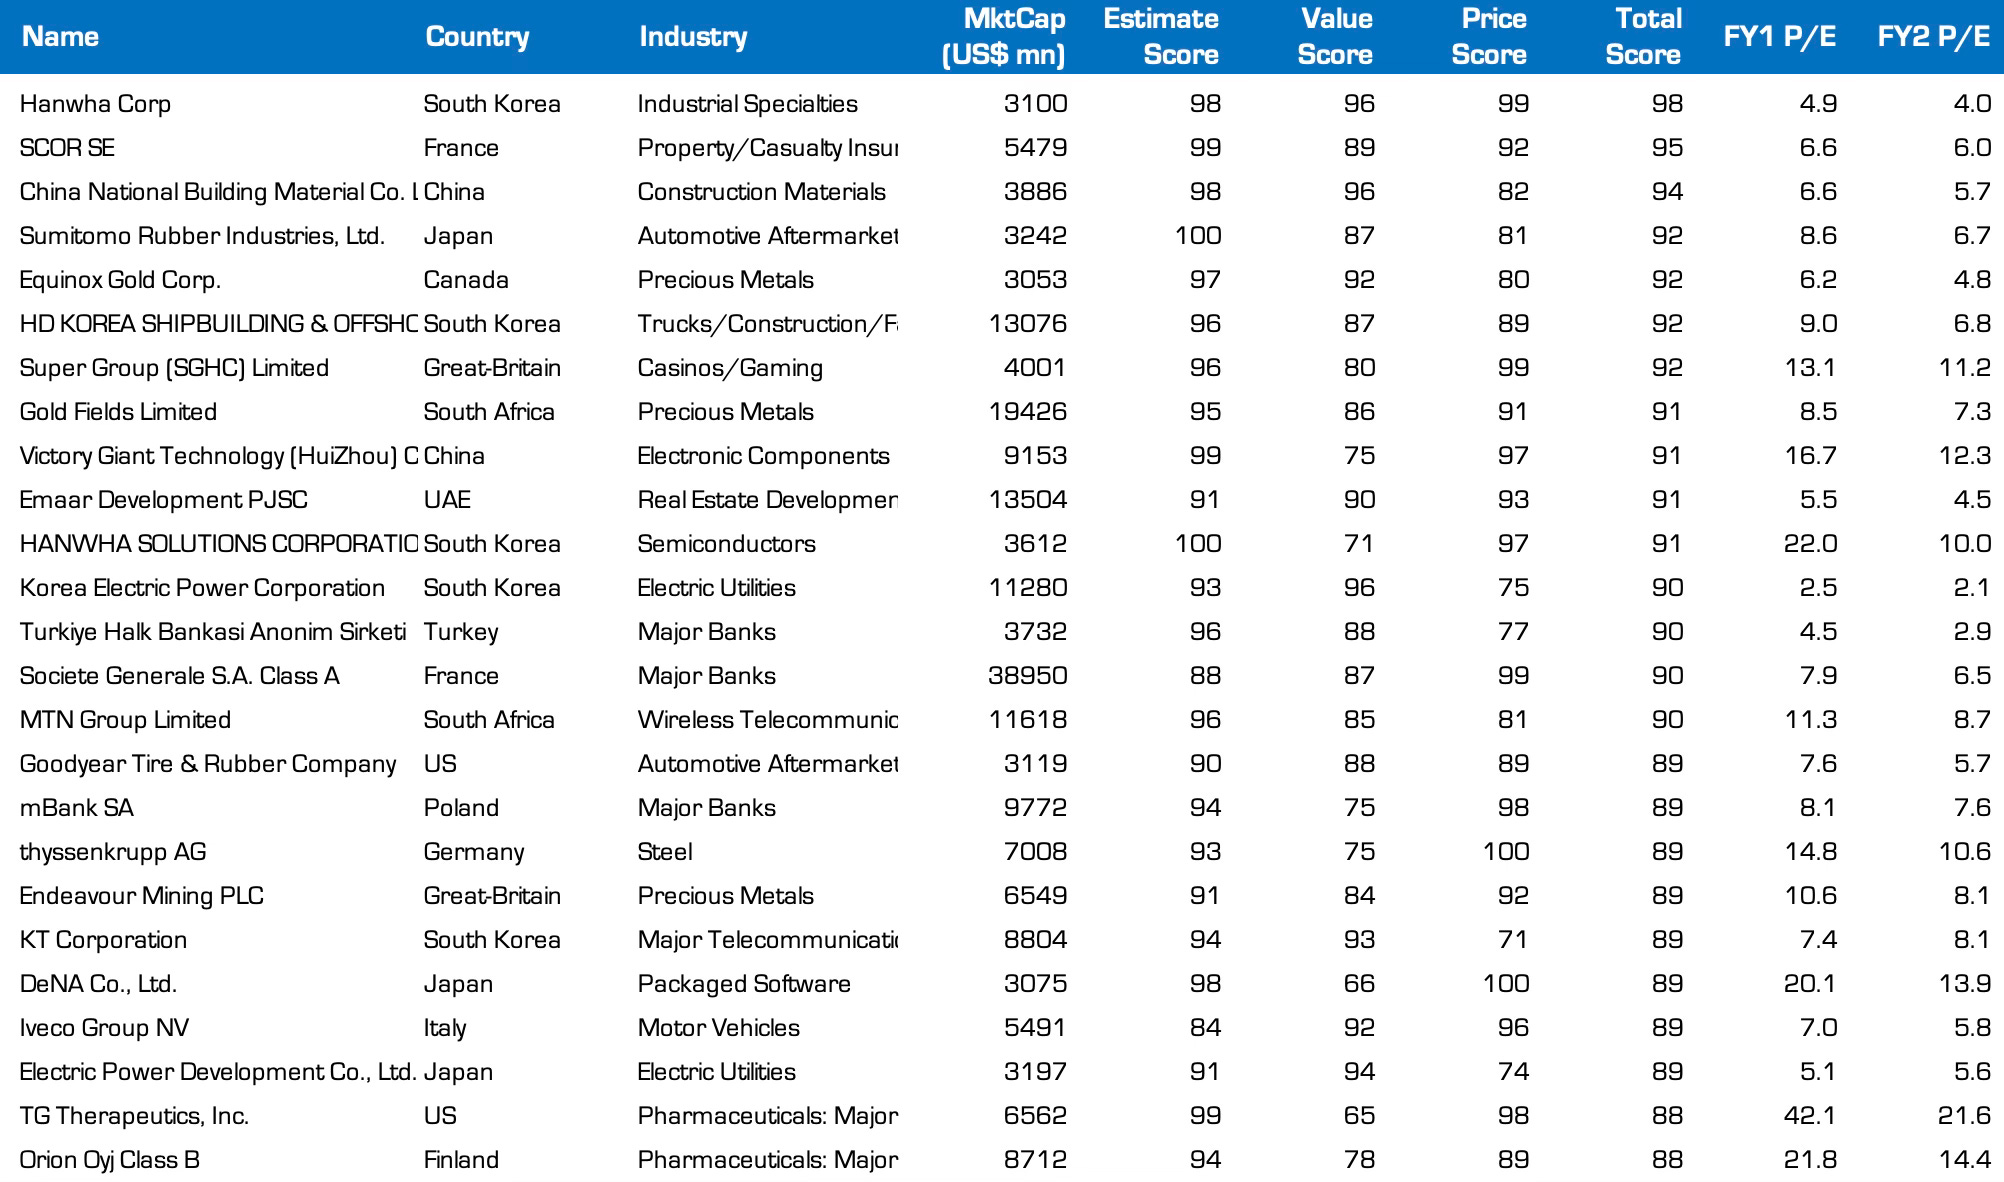
We’ve talked about South Korea many times and own the ETF.
And no surprise to see a Chinese Building Materials Company doing well. We know China is rebounding.
Same with gold miners (Equinox, Gold Fields, Endeavour)
Dubai property development. Get it.
Backdoor defense companies (Iveco, HD Korea Shipbuilding)
European banks (Societe Generale, mBank).
Mobile Money (MTN Group)
We also know why Tires and rubber are doing well (Sumitomo Rubber and Goodyear).
We know all that.
None of this is surprising. Not the mystery.
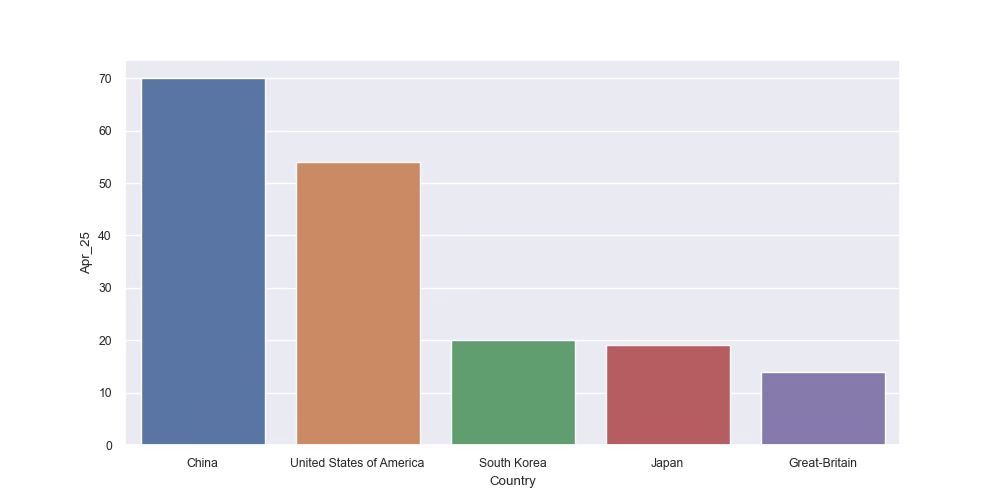
Country Level Trends
And at the country level we know why China now ranks the highest in the world.
And we’ve been bullish on the other China too (the UK).
All the trends so far are the same as before.
Now we get to the mystery.
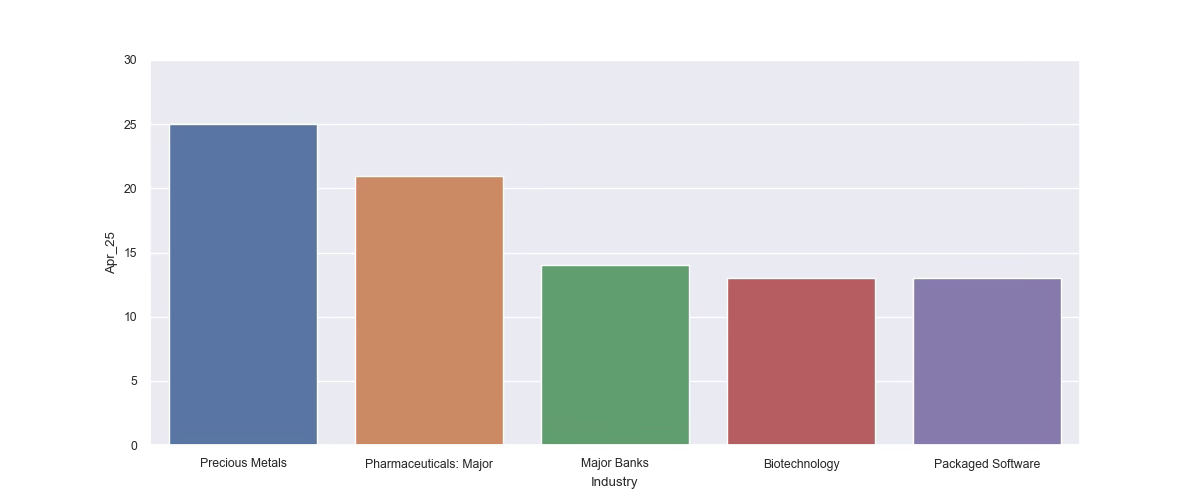
Top 5 Ranked Sectors
When we look at the sector data gold miners are the top ranked sector in the world. Which is understandable, even if no hedge funds own them.
But what is the deal with Major Pharma and Biotech?
Why are these two related sectors 2 of the top 5 ranked sectors in the world?
And when you look at the monthly trend you see how both sectors really ramped up starting in January. Biotech especially.
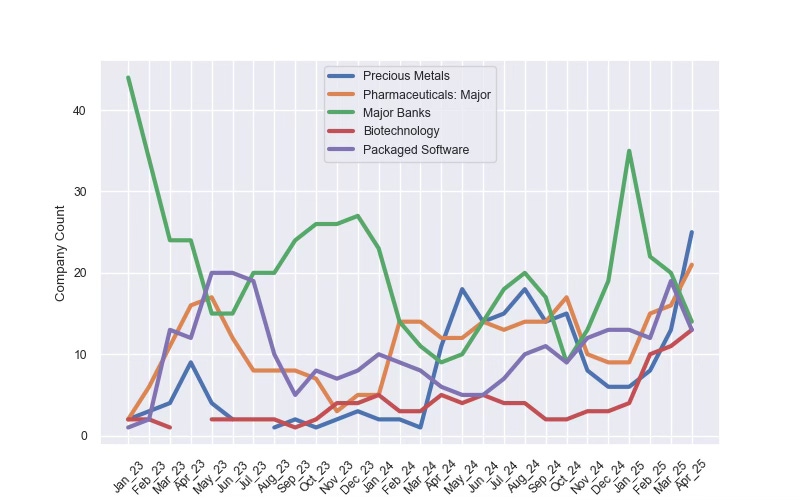
What’s going on?
Our YWR data tools have uncovered the ‘what’ but we don’t know the ‘why’.
Why did both these sectors suddenly start scoring well starting in January?
The Consensus View
I spent all yesterday asking around for ‘the story’. Remember, when a sector keeps beating numbers you need to find the ‘why’ (Why Estimate Revisions Work), and usually, it is two layers down.
I started with Le Shrub because he’s had a great call this year on Biotech (Only Monkeys and Shrubs pick bottoms).
And the Shrub pointed to how hated the sector was, the undervaluation, and the possible changes from the FDA around drug approvals.

Which is all useful, but more a reflection of sentiment and valuation. It didn’t explain the changes in estimate momentum.
Next I reached out to Jonathan Kulok who helped us with Inmune Bio (The 20X upside in Inmune Bio). But Jon mostly repeated what Shrub said. The sector is hated, and the changes to the drug approvals are massive.
Finally, I reached out to an experienced pharma investor who had worked for Amgen in the past. He didn’t know either, but was intrigued by the data and gave us a clue. He said pricing is usually fixed/regulated, so if there was a surprise in earnings it was most likely coming from prescription volumes.
So we had a suggestion, investigate the volume growth, but nobody had the ‘story’.
Nobody could explain what I was seeing in the YWR Factor Model Dashboard. Substantial, and sudden estimate changes for 2025 through 2027 across a range of pharma and biotech companies.


So the experts were no help. They couldn’t see a pattern or cause. And I couldn’t either. I didn’t get it.
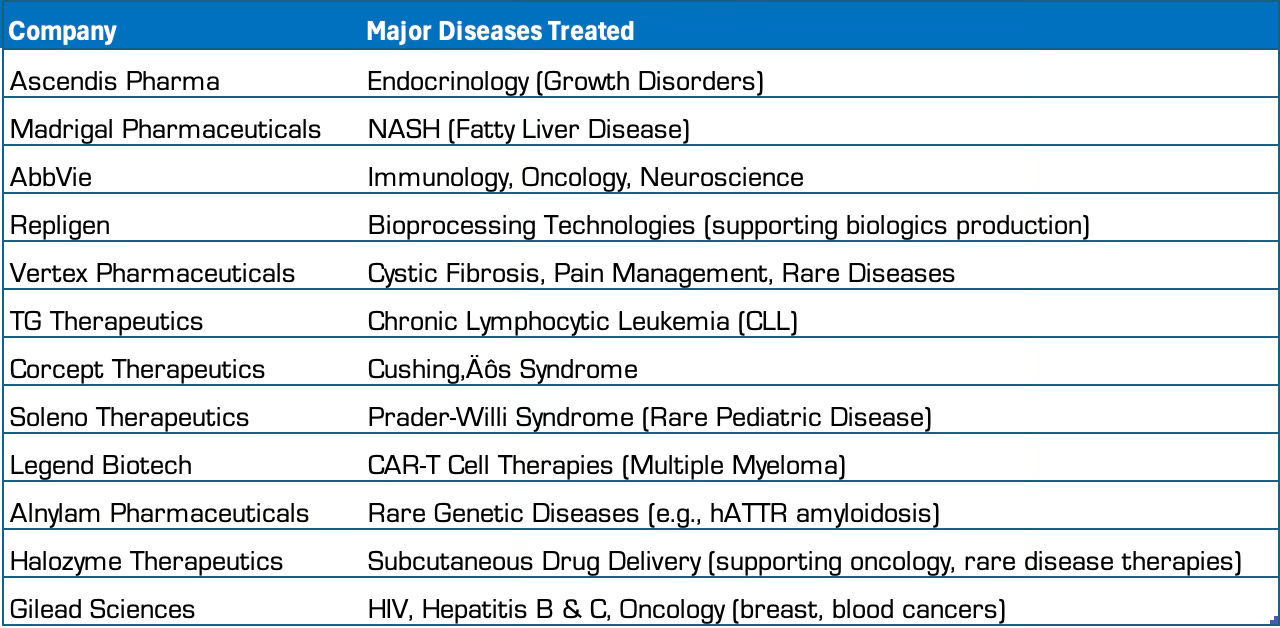
These companies seemed to be addressing rare, unrelated diseases. But why were they all blowing the lights out at the same time? What was the pattern behind the pattern.
Next I tried something new.
One of your YWR peers, Drew Meister developed a super cool AI tool to search for themes across company transcripts. It’s Dotadda Knowledge. So I started feeding Dotadda tickers and searching the conference calls for common themes.
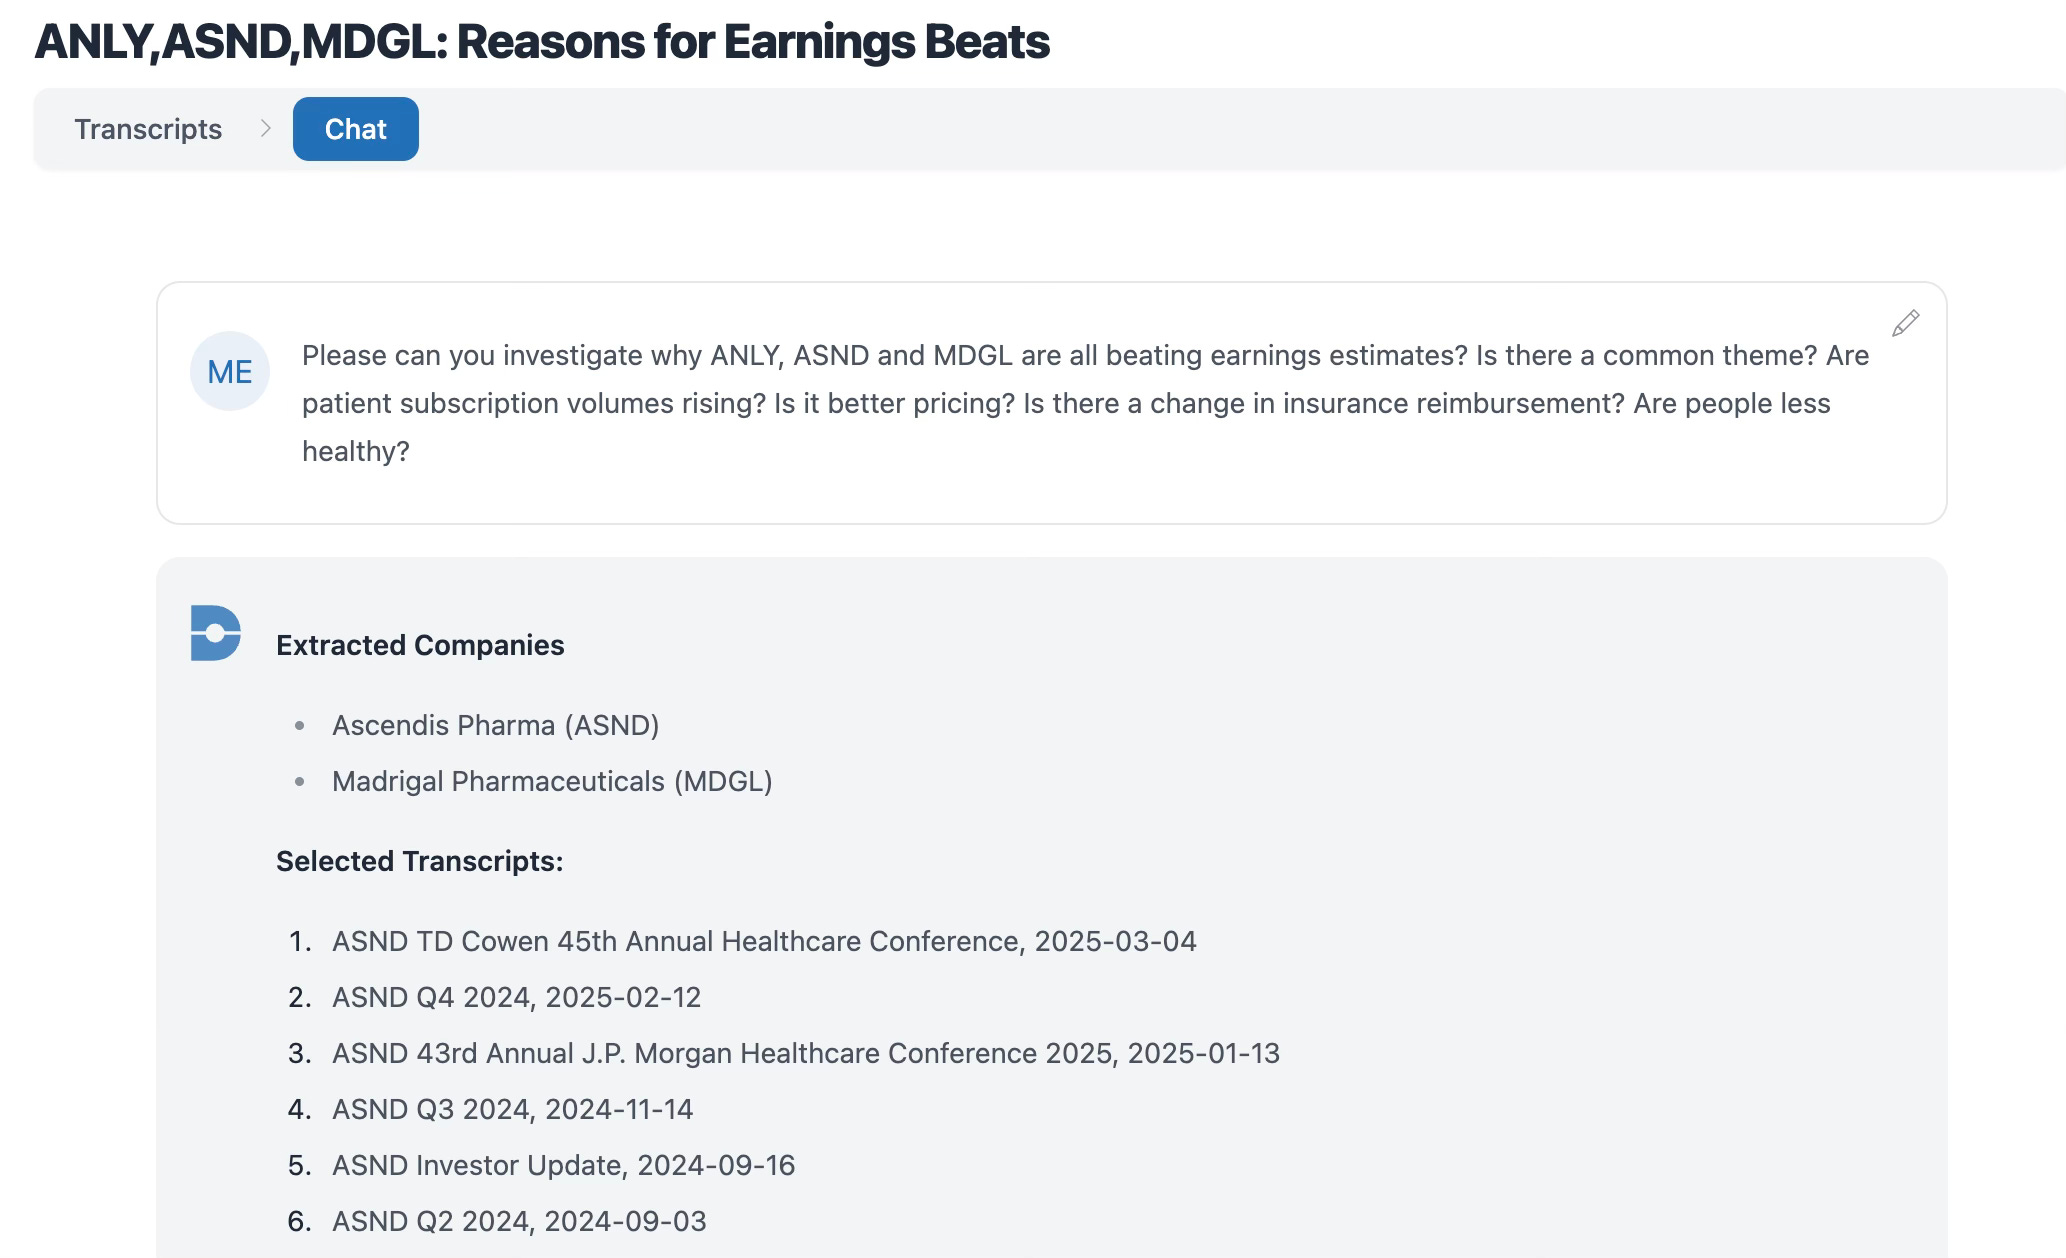
Dotadda picked up that there were quite a few mentions of strong volume growth. As our third expert had expected.
“Sequentially, SKYTROFA volume increased 16% in Q4 compared to Q3, while pricing was stable.”
— Scott Smith, ASND Q4 2024
“The fourth quarter numbers and full year numbers exceeded our guidance and reflect the growing demand we are seeing for BRIUMVI.”
— Adam Waldman, TGTX Q4 2024
“Each successive quarter of 2024 brought a record number of new Korlym prescribers and patients receiving Korlym.”
— Joseph Belanoff, CORT Q4 2024
Volumes are growing, but no real explanation of why.
But I think I know what it is.
And strangely nobody is talking about it.
All these diverse pharma companies are suddenly seeing more prescription volumes. And interestingly, they are mostly mid-cap companies covering niche diseases. This isn’t Merck, Pfizer and J&J blowing out numbers. For the most part it’s the smaller players. And notice how many times the word ‘rare’ comes up in the description of the diseases they address as in ‘rare genetic diseases’.
So either everyone is suddenly contracting rare genetic diseases, which is possible, but shouldn’t change sharply over 6 months starting in 2025, or… there is something else driving this.
Which leads to my other hypothesis, a reason alluded to indirectly but never mentioned in any of the conference calls.
There has been a change in insurance coverage.
And when you look for it, you find there has.
Why are ‘volumes’ suddenly growing, because Medicare is now paying for it.
The Inflation Reduction Act
The Inflation act of 2022 contained big changes to the co-payment for drugs. The changes started in 2023, but really kicked in this year. In 2023 and 2024 there were changes which smoothed drug co-payments, but 2025 was the biggie. 2025 is when the out of pocket expense for drugs covered by Medicare was capped at $2,000.
There you go. Get whatever drug you want, and don’t worry. The max you will ever pay is $2,000. And I’m sure the doctors love prescribing new expensive drugs, if nobody has to pay for it.
There are also changes to Medicare Part B and the coverage of biosimilars

And so we find the story behind the story of the surprising estimates momentum in niche drug companies.
And the good part is nobody knows what’s going on, or why, so the trend will likely continue.
As usual all the links are below.
The factor ranking spreadsheet with ranking data for over 3,000 companies.
YWR Global Factor Dashboard with the useful charts on earnings momentum.
The Tableau Dashboard which is useful for looking at the data on an industry basis.
