YWR: A Private Equity Train Smash Update
Last year in Anatomy of a Private Equity Train Smash we made a bold call.
That private equity would be the worst asset class of the next 10 years.
Today we build on that view with the 2024 year end data plus new insights on the state pension fund industry from Equable.
But it’s not all bad.
The Harvard Management Company tips us off to the best performing asset class of the next 10 years.
But we get to that at the end.
The Set Up
2024 Data Update
Stay away from people who are drowning.
Harvard’s Asset Class for the Future
The Set-Up
There’s a dirty secret in asset management.
You raise money when you can. Not when you should.
Investors don’t come in at the bottom when risk/reward is fantastic and you are begging them for a meeting. Nope.
They come in 10 years later at the top when valuations are peak, and the trend is already over. The nice thing though is that at the top you don’t beg for meetings. People you’ve never hear of come out of the woodwork and find you.
And you feel bad that they’re coming in when the move is over and the risk is to the downside. But for business reasons you smile and wave them in. Yup. Collect the management fees, put a brave face on it and hope the downside isn’t too bad (for them).
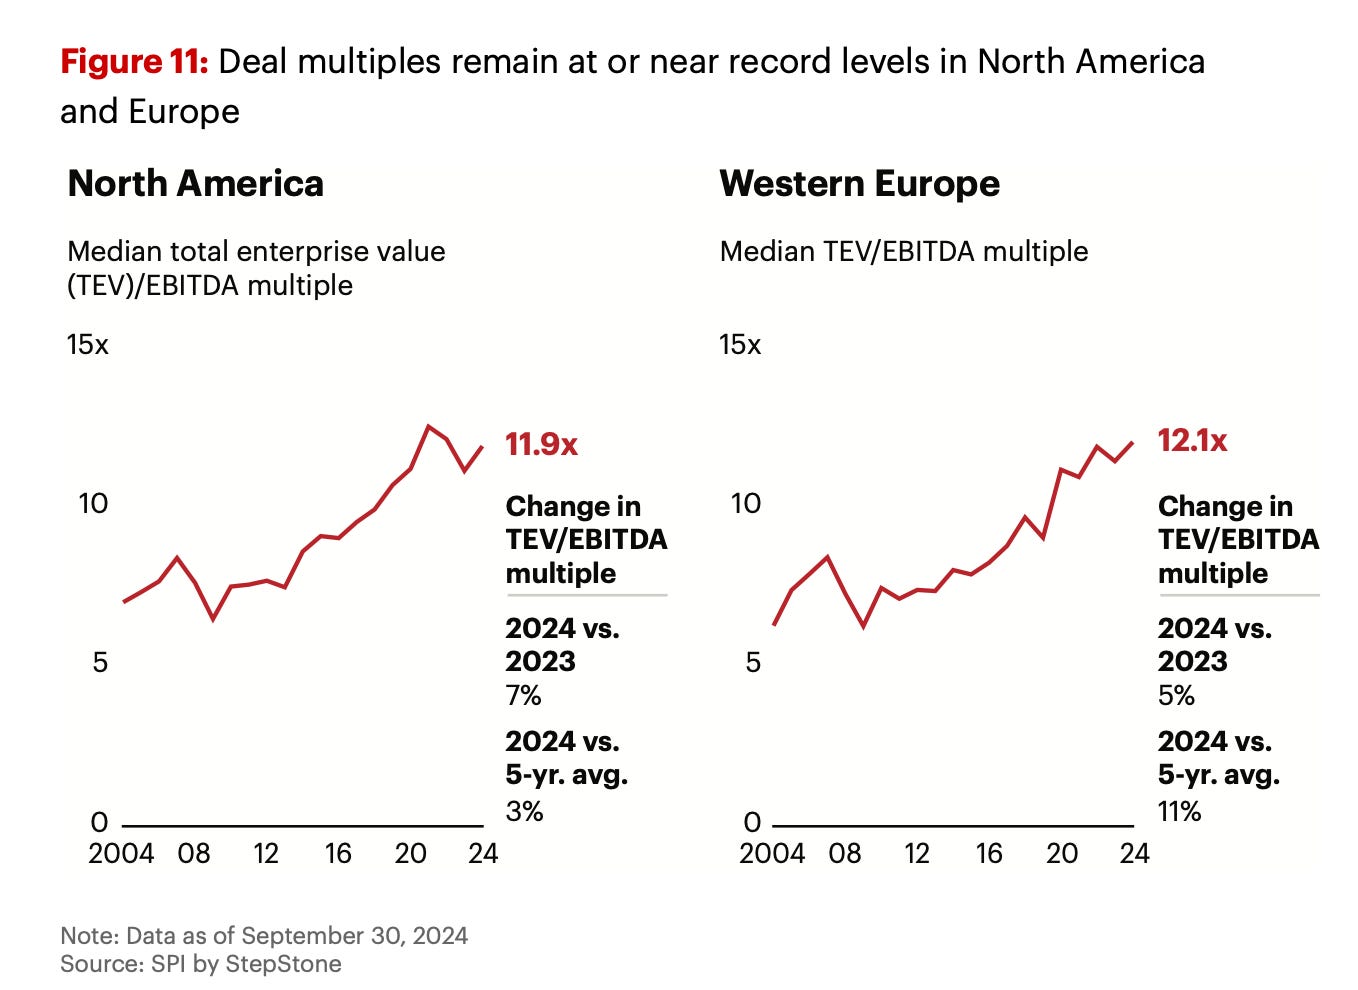
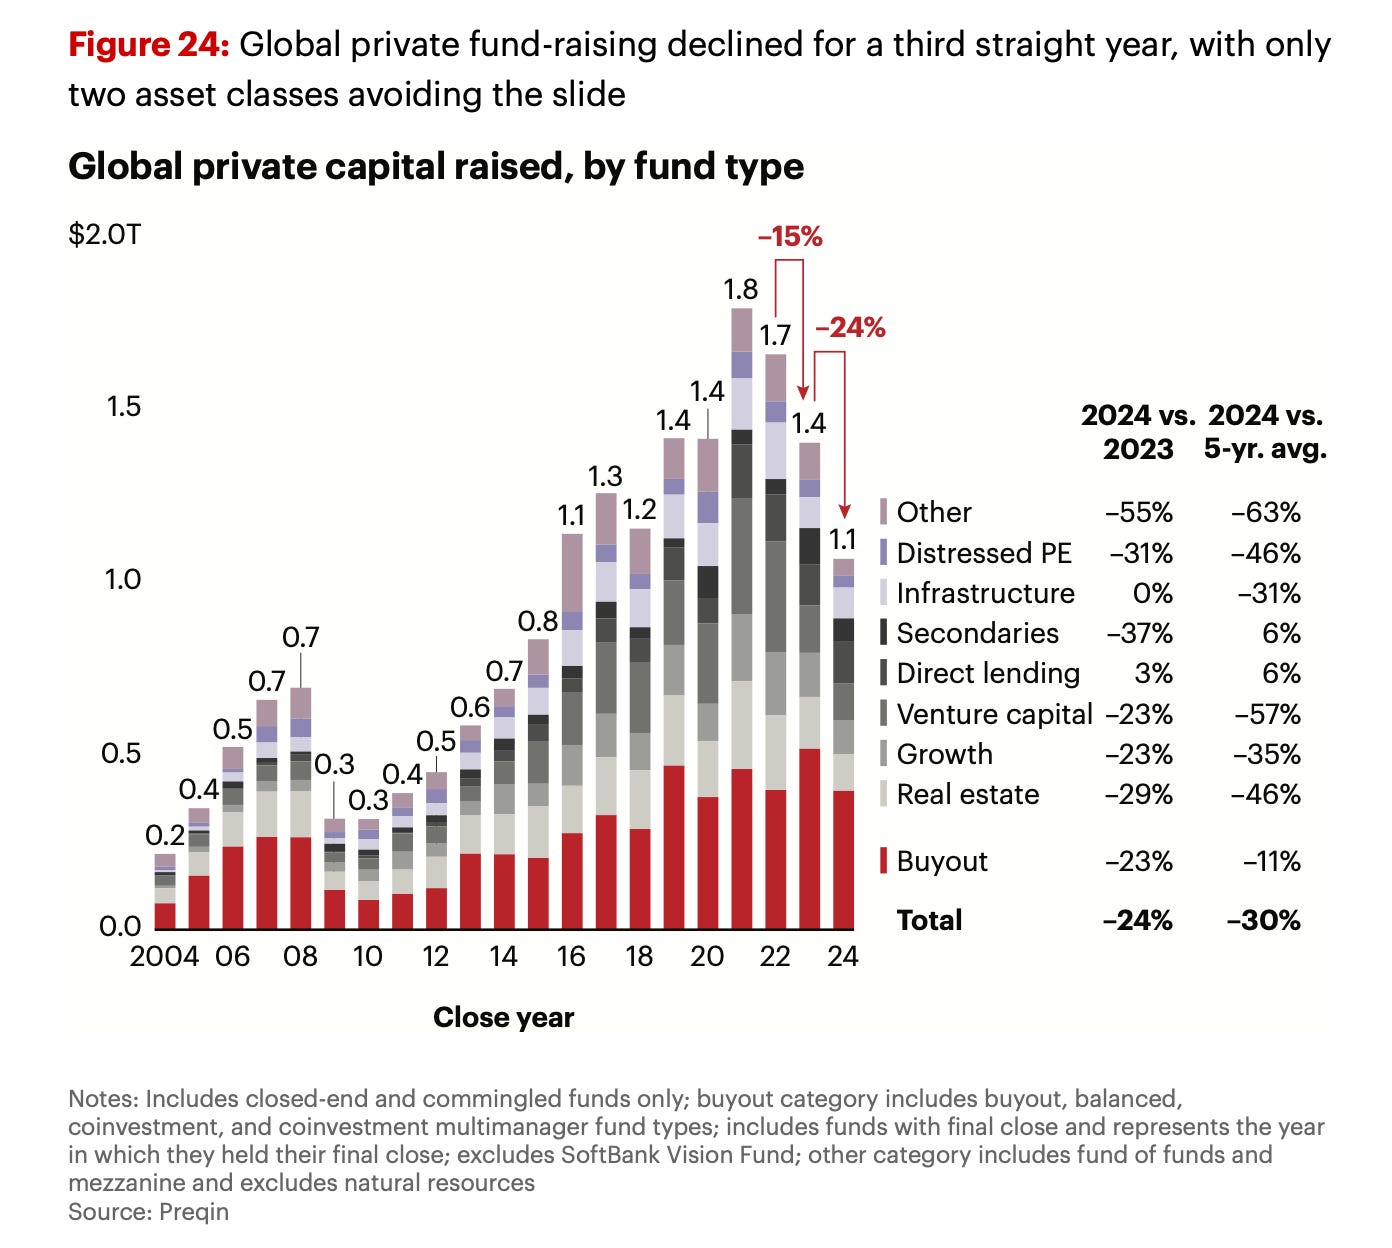
Which is why when $3.5 trillion piled into PE/VC in 2021-2022 after over 10 years of stellar returns, at record deal valuations, we expected the future would be awful. That over the next 10 years PE and VC would be a multi-year torture chamber with investors begging for their money back the whole time.
2024 Data
It’s only been a year, but what’s the update?
We now have the 2024 data and we see that as expected investor enthusiasm to put new money into private equity declined further with only $1.1 trillion of capital raised.
Remember, this is an asset class highly sensitive to flows. Reduced inflows and tighter liquidity puts pressure on stated valuations, which PE firms work to smooth as best they can. Because that’s a lot of what they are selling you. A managed P&L. Less money coming into the system, also makes it more challenging to exit. Kind of like African FX.
And about getting your money back…. that was already a problem in 2022 and 2023. Did it get better in 2024?
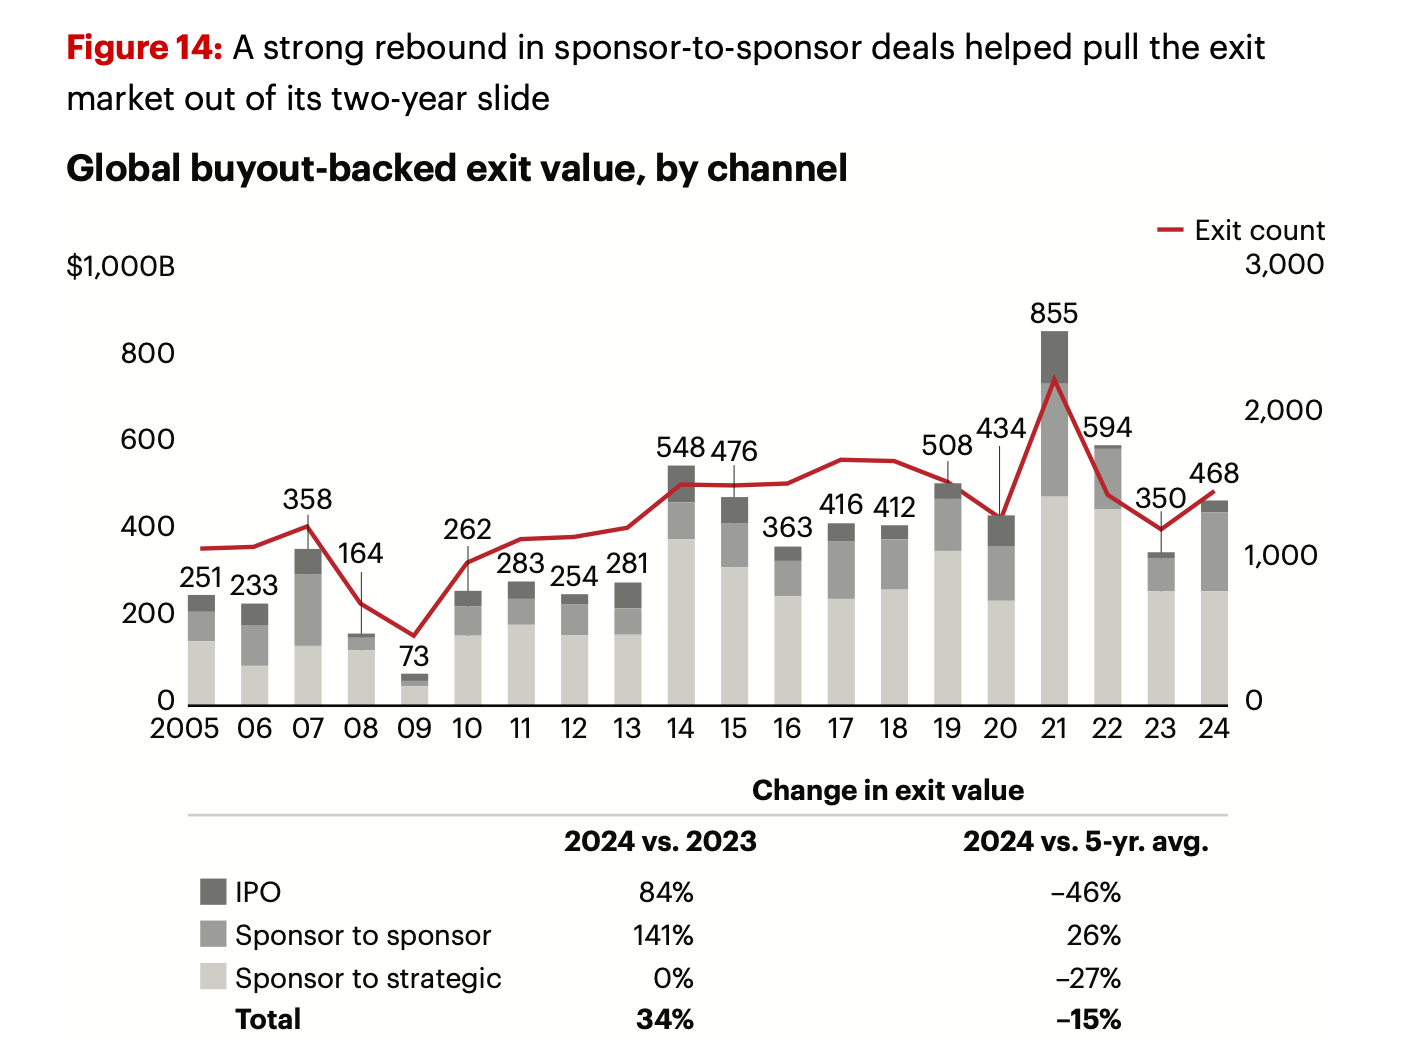
Distributions were +34% in $ terms, to $468bn, but given the larger fund sizes of the funds it’s historically low returns as % of AUM.
It starts with a simple statement: With the exception of a spike in 2021, the amount of capital returned to investors is not keeping pace with the industry’s increasing scale. While global buyout AUM has tripled over the past decade, distributions as a percentage of NAV have fallen from an average of 29% from 2014 to 2017 to 11% today. Bain Private Equity Report 2025
The low level of asset sales that we did see involved a record level of sales to other private equity funds (Sponsor to Sponsor).
In Sponsor to Sponsor you are selling to another PE fund or maybe a Secondary Opportunity Fund set up by your own GP to take advantage of your liquidity problems.
How wonderful. Thank you.
Buying your assets at a discount is a thriving new asset class for PE Managers. But it kind of sucks if you are the pension fund in the original funds.
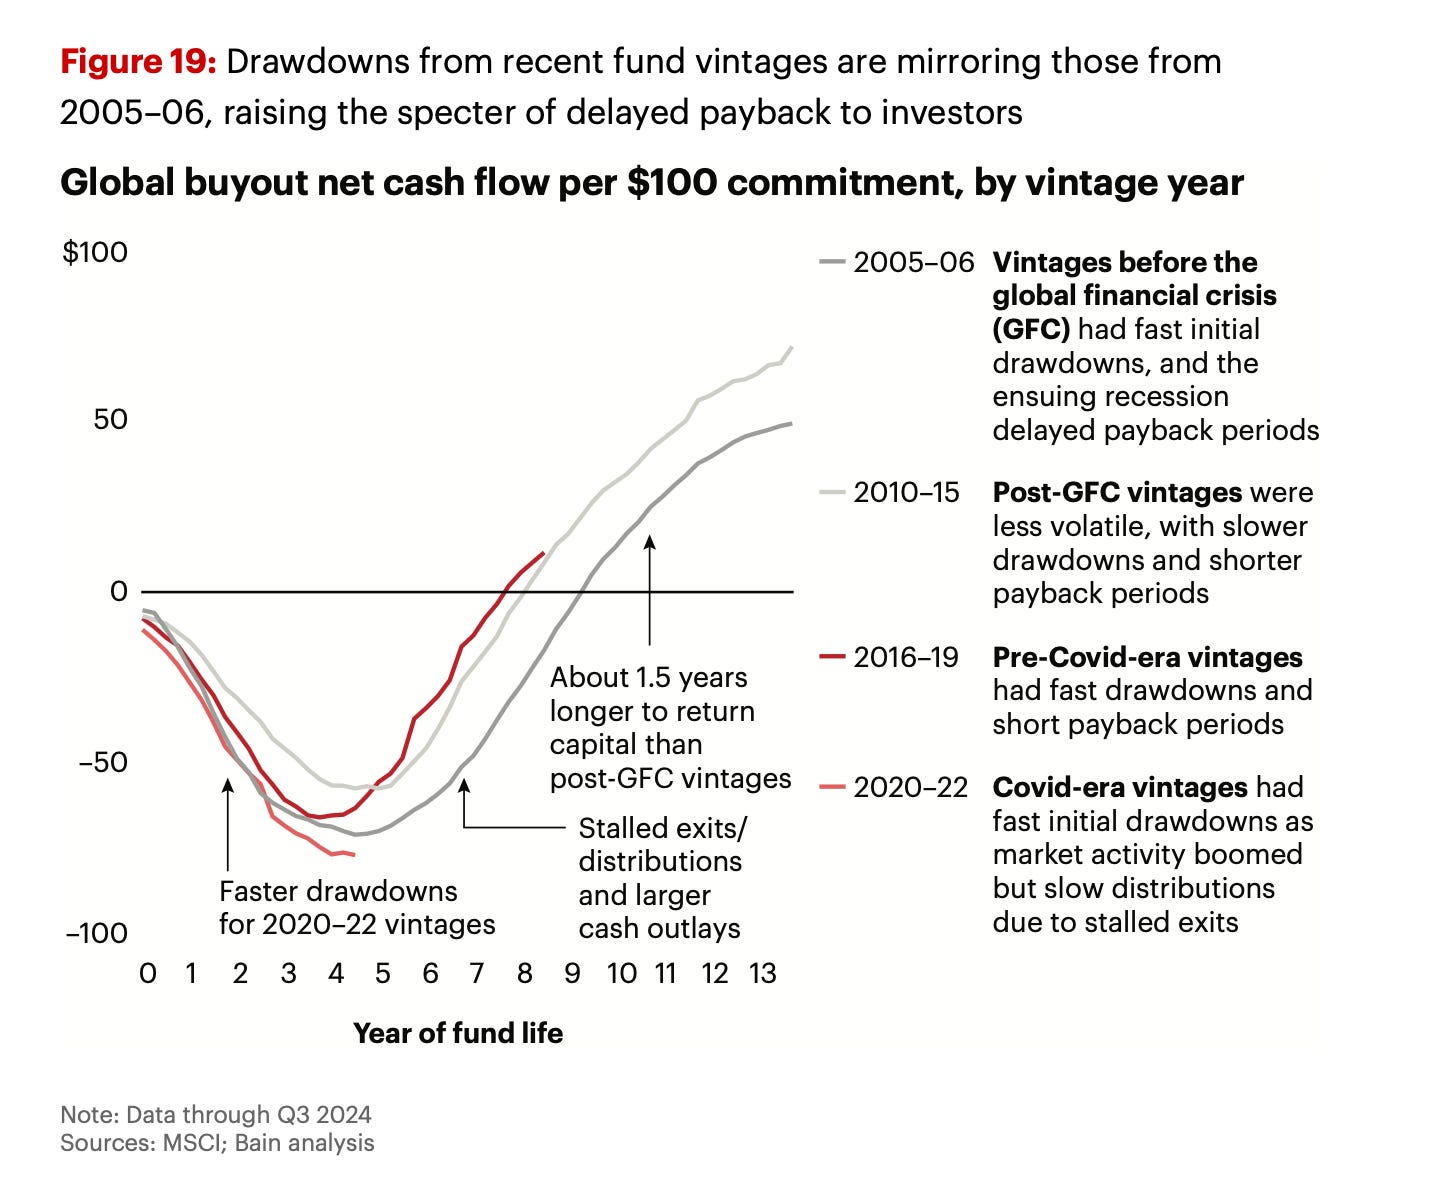
And how about the ‘IRR’s’? That highly manipulated and misleading calculation of return. The final IRR will depend on the how the investments turn out, but already the years 2020-2022, when all the money came in, are on track to be the worst vintages ever. 2020-2022 resembles 2005-2006. A quick drawdown of capital and then a long payback period.
And what about IPO’s? The market’s hot. Can’t those happen?
IPO’s have been surprisingly difficult. Well, not surprising. Nobody wants to be the bag holder for the PE funds.
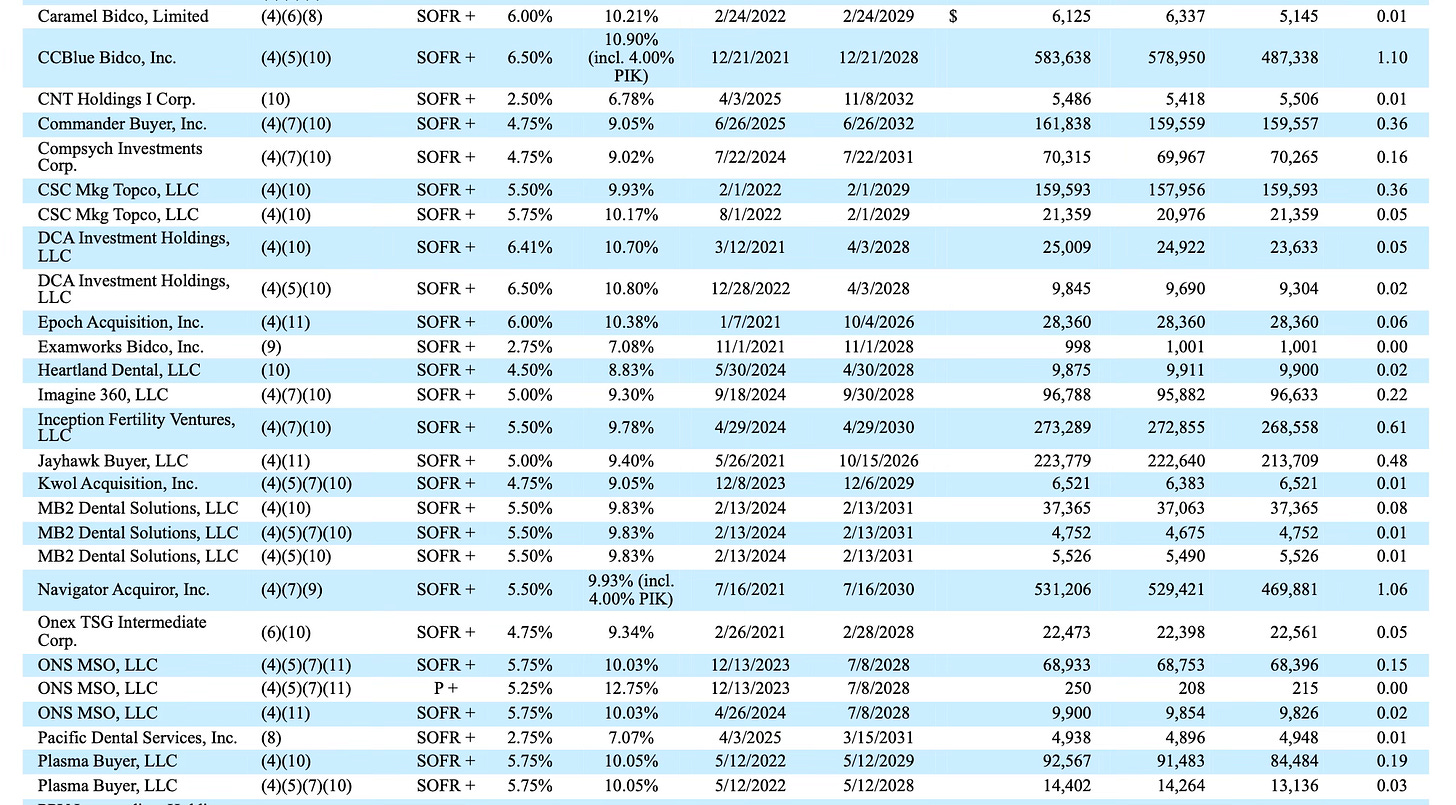
1. There’s been a complete narrative shift since 2022. If you want to IPO Spacex, Anduril or Anthropic maybe that could be interesting. Otherwise, nobody in public markets wants a boomer pre-AI SaaS company, a dental practice roll-up, or a warehouse logistics company.
There are few humans with money left in public markets to look at deals. Active managers are getting outflows non-stop to passive and ETF’s. Hedge funds aren’t getting inflows either. Although a pod podshop ECM desk might give you a few million if the deal is hot and they can flip it. Again, has to be hot. No dental practices or logistics companies.
How about performance? Has it been a train smash?
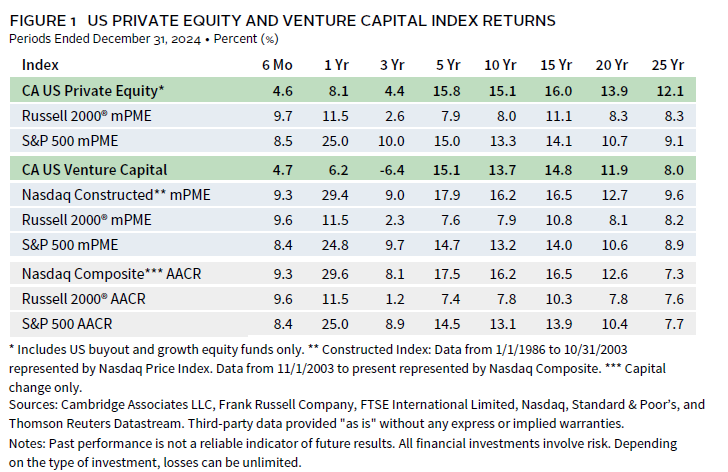
The trailing 3 years have averaged 4.4% for the PE index with caveat #1 that this is highly dependent on which vintage and manager you own, and caveat #2 that much of this performance is determined by the PE funds themselves. Like scoring your own test.
Even so, 4.4% is not a train smash. If that is the extent of the train smash, then private equity looks pretty good.
But there are reasons to think we are not out of the woods and things can still get worse.
Stay away from people who are drowning.
You know how they tell you to stay away from people who are drowning? Throw them a life preserver, but don’t let them grab your arm and pull you down with them. To me that’s PE.
The problem is two of the biggest PE investors, endowments and pension funds, have cash flow problems. They are highly allocated to an illiquid asset class with large operating cash flow needs.
Harvard’s Endowment for example is 44% allocated to PE and Real Estate with the distributions from the endowment funding 40% of the operating budget.
Twenty years ago, Harvard’s endowment distributions accounted for 21% of the University’s budget. Ten years later, it had grown to 31%. Now, it is approaching 40%. The ever-increasing reliance on this critical resource makes our work all the more important. Source: HMC 2024 Report.
Max allocated to PE with no flexibility on cash flow distributions to the university. Princeton and Yale are the same. Stanford is a bit better (21% of the university budget).
This combination of high payouts to the university, with low PE returns is making it hard to grow the endowment. The CAGR for actual growth of the endowment in $ terms for the 4 of them together is 0.6% since 2022. In a bull market.
It’s a fragile situation, because if we ever get into a real bear market, these endowments will get into a negative spiral where they are continually eating into their principal. This would mean more pressure on the GP’s to sell assets to create liquidity.
Public pension funds, another big PE client, are the same. Underfunded and over allocated to an illiquid asset class. Although not as extreme as the endowments, pension funds have also been steadily increasing their exposure to private equity.
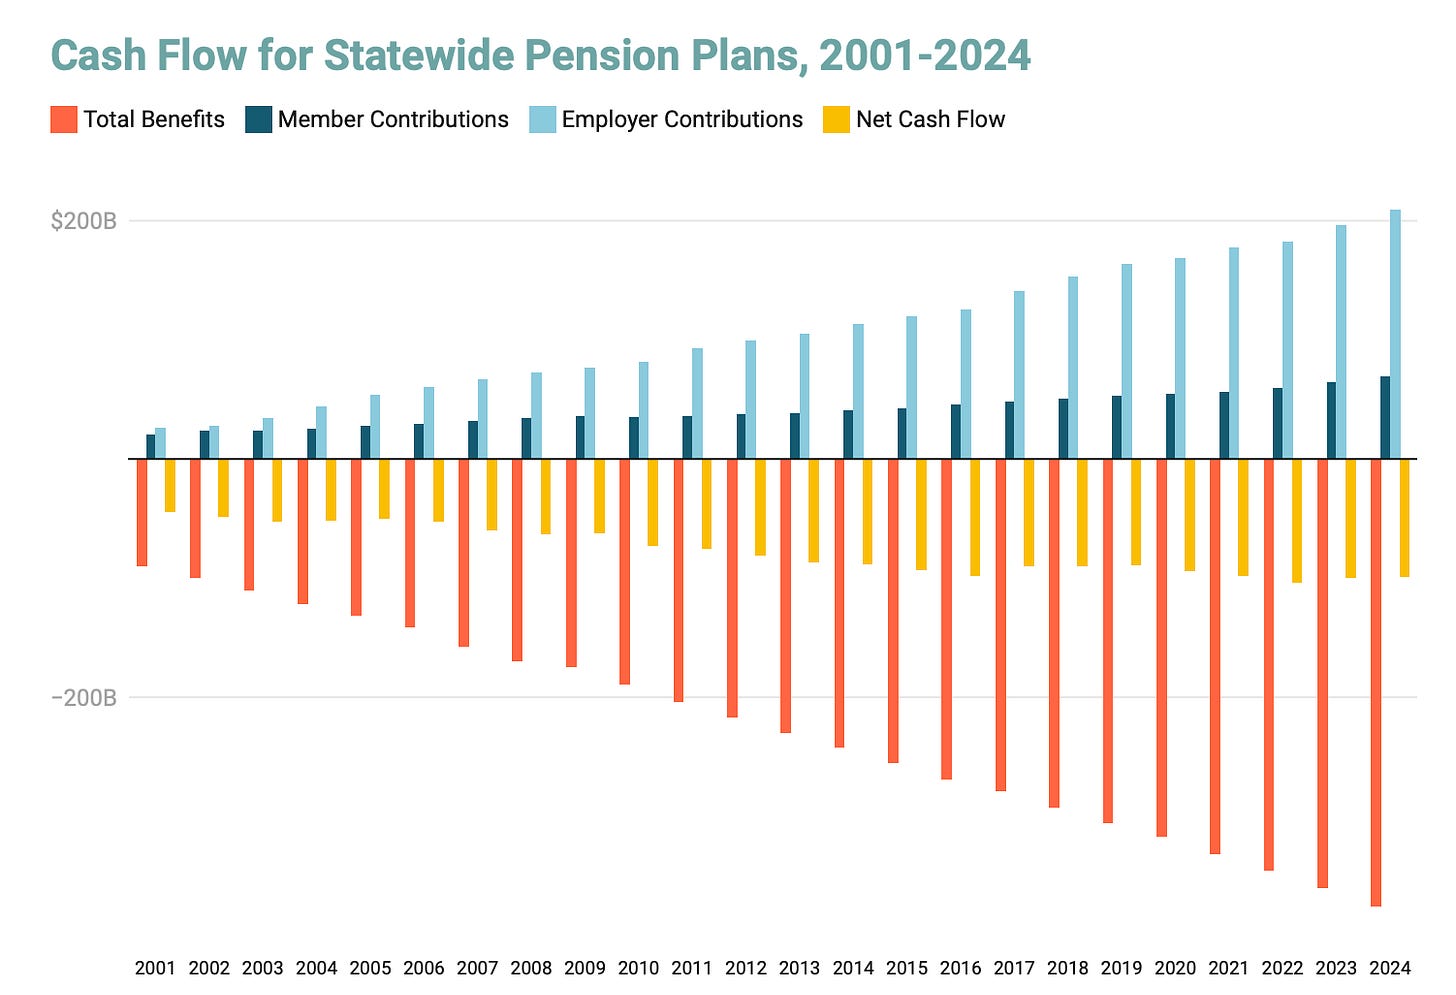
Maybe 26% allocated to private assets is not extreme. But like the endowments they have cash flow issues. State pension funds are underfunded by $1.35 trillion with a growing ratio of beneficiaries to active members. This means the plans are all cash flow negative every year. They need PE distributions to pay member benefits. There is no flexibility around this.
Interestingly, Equable also describes the situation for state pension funds as ‘fragile’.
So if you had fresh capital and were trying to figure out an attractive asset class to invest in for the next 10 years would you want to get involved in this situation? Co-invested with endowments and pension funds struggling for cash.
Or, would you prefer an asset class where investors have already exited and money is flowing in, instead of out?
Here again we thank the Harvard Management Company for clarity.
Harvard’s Asset Class for the Future
Can you guess what might be the best performing asset class of the next 10 years?
I’ll give you a hint.
It’s already in a bull market and Harvard sold it all to buy more PE.
HMC’s asset allocation has featured three interrelated portfolio moves over the last seven years. First, we reduced the exposure to real estate and natural resources from 25% of the endowment portfolio in FY18 to 6% today. This strategic reduction has had apositive and compounding impact on the University’sendowment returns. It has also created room for the second major portfolio shift, which is our significant increase in private equities.
Natural Resources.
I’ve provided links below to the presentations from Stepstone, Bain and Equable. Plus, a fun one from KKR. Be a GP not an LP.
Have a good rest of the week.
Erik


