
YWR Data Apps

“What is your investment process?”
I hate that question. I hate it because you can’t say the truth.
When you are pitching to fund allocators it’s what they always ask.
And the answer they are looking for is a description (with a powerpoint slide) which describes your investment process as a sausage factory. Repeatable and consistent.
In reality good investing requires a lot creativity and imagination, but those are not words fund allocators want to hear. ‘Creativity’ and ‘imagination’ imply the possibility of inconsistency.
A fund allocator would probably ask Van Gogh for the painting process behind Starry Night.
What I like better than ‘What is your investment process?’ is ‘What are your investing tools?’
I see the investor as a skilled and creative craftsman. What special tools have you developed to do your job?
Which is why at YWR we are always developing our investing tools.
Our latest innovation is an app version of the Global Factor Model and QARV. Note these apps are best viewed on a desktop, not mobile.
I’ve provided links to the data apps at the bottom of the post, but they are also at the top of www.ywr.world (Data Apps)
Global Factor Model Dashboard
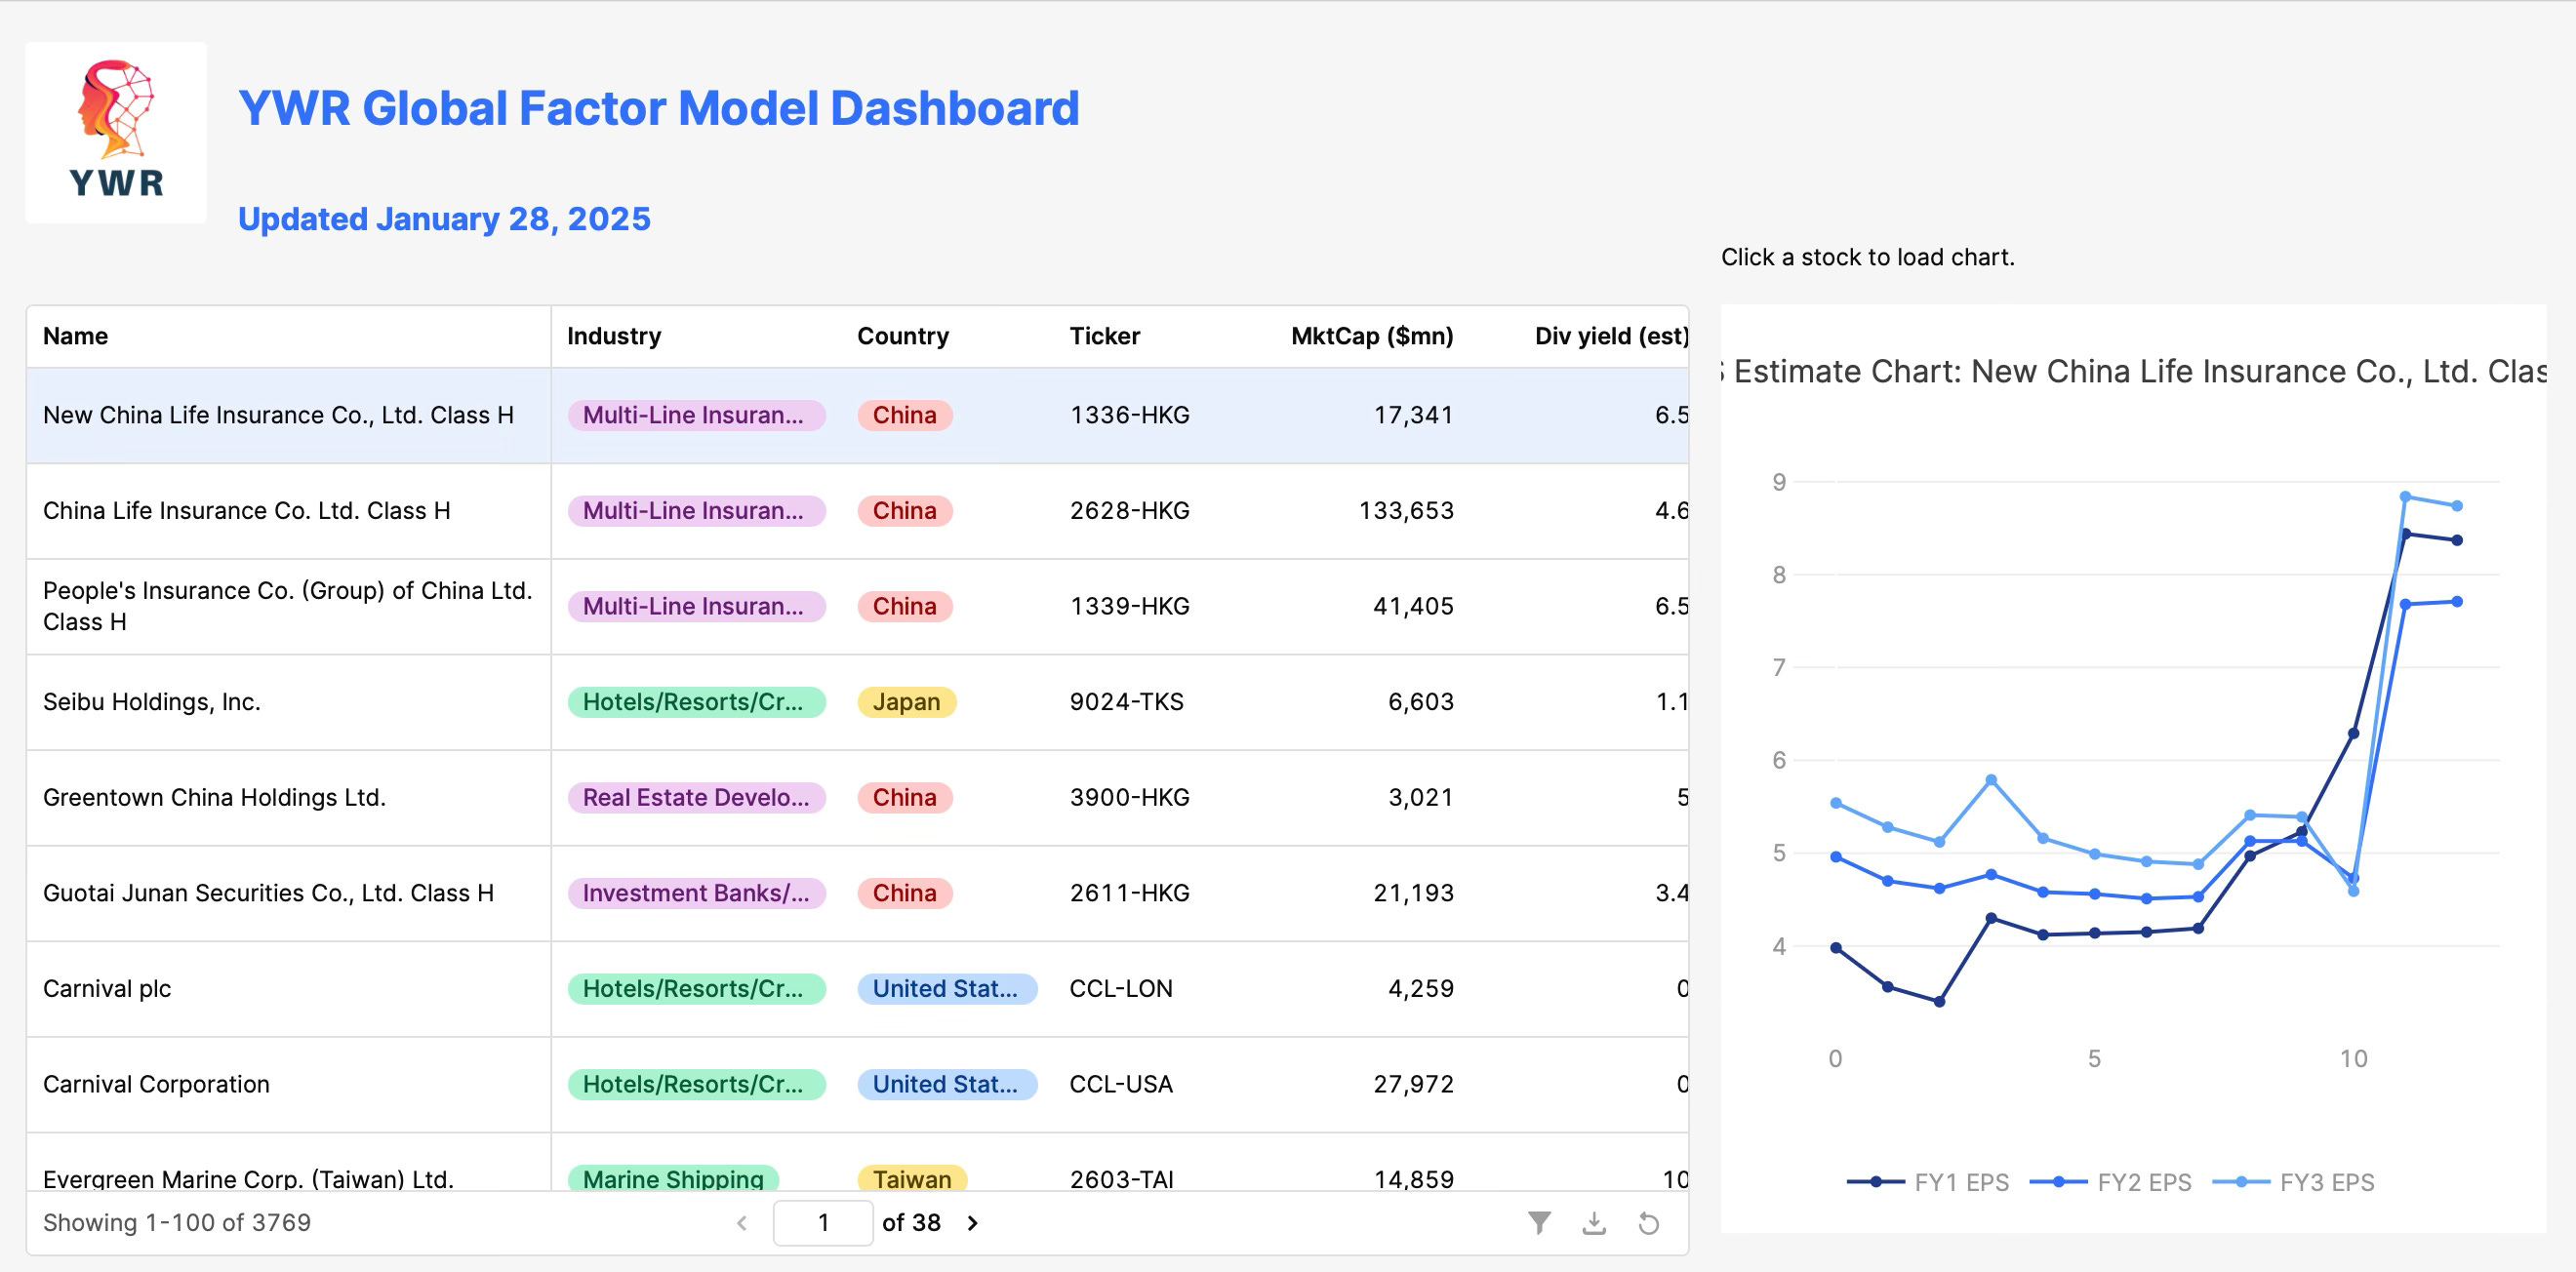
We love to connect the dots in creative ways, but we need to start with good dots. In the Global Factor Model positive changes in earnings estimates are combined with valuation metrics to create a global ranking of over 3,000 stocks.
The Global Factor Model tells us where earnings estimates are changing globally. It’s the quantitative version of scanning the investing news. Big changes in earnings estimates tells us where events are not playing out as expected. When we see these big estimate changes our job is then to be like a news reporters and find the story. Find the ‘why’ and ‘can there be more?’
Now we have the Global Factor Model rankings either in Google Sheets or on a web based dashboard.
I’ve also added an earnings estimate chart which should be useful. It’s been a consistent complaint from readers that it’s hard to find charts of forward earnings estimates over time.
When you click in a stock on the table it updates the earnings estimate chart to the right. The estimate plot at each point is the average analyst earnings forecast for the previous 100 days. The chart is the last 12 months of estimate history for FY1 (current year), FY2 (next year) and FY3 (two years from now).
In the bottom right hand corner of the table are filter and sort buttons.
Try it out. The data is updated monthly.
Now if an allocator asks you how you keep on top of everything happening in the world, how do you spot the trends, tell them you have the Global Factor Model dashboard.
QARV Dashboard

QARV (Quality at a Reasonable Value) is a different tool. It is built to identify those high quality companies which quietly perform over time. It is a global ranking of stocks with consistent profitability, low debt, and growth, but also with attractive valuations.
We now have an online version of the data which hopefully makes it easier to click, filter and sort for whatever you are looking for.
If you want the Google Sheets versions of either the Factor model or QARV they are still available at www.ywr.world under the Global Factor and QARV tab.
Retool
I want to highlight Retool, the software I used to build these apps. I came across it because I noticed the OpenAI guys using it during a demo.
The simplest thing you can do with Retool is build a webpage for a data table (what is what I was looking for), but the functionality gets a lot more complex, such as creating eventHandlers where certain changes in the table trigger an email alert.
You can do some basic things with Retool using point and click, drag and drop, but with a bit of knowledge of JavaScript you can create whole work flow processes.
As I got more into Retool I ended up studying the courses in Retool University, which gives cool demos to show you how to build things. For example, you can even insert AI API calls into your tables and data.
If you want chat about Retool and any data ideas you have, let me know.
Below are the links to the data apps.
For convenience I’ve also included a link to the Tableau Dashboard we use.
I hope you find it useful.
