
YWR: Global Boom Charts

The Theme of May’s Killer Chart pack is the Global Boom Nobody sees Happening (except us).
And for money making this is SUCH a good opportunity. It’s rare so many investors miss something this big.
May’s Killer Charts is 39 slides with sections on:
Sentiment and positioning
Earnings estimates
Global Boom
Deficits (and why we love them)
Global Rates (what they are really telling us)
Flows
The full chart pack is at the bottom, but let’s go through it step by step.
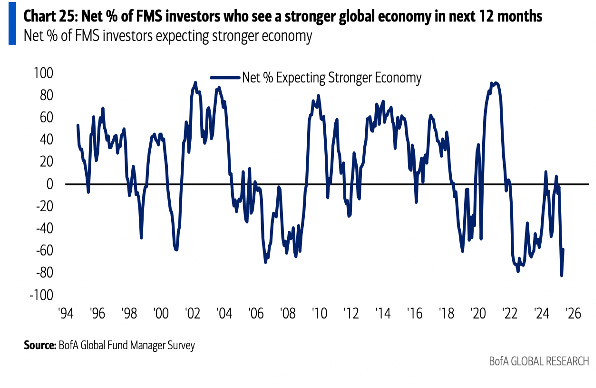
#1 EVERYONE knows the economy will be terrible.
Investors are abysmal about the economic outlook (slides 3 & 4)
And the Fed will of course have to cut rates twice because the economic outlook is so weak (slide 5).
#2 The ‘Smart Money’ is at record low net long exposure. Hedge Fund net exposure is at the lowest 3% of observed levels on a 5 year view (Slide 8). This is a great contrarian signal.
#3 Meanwhile Global GDP is Booming
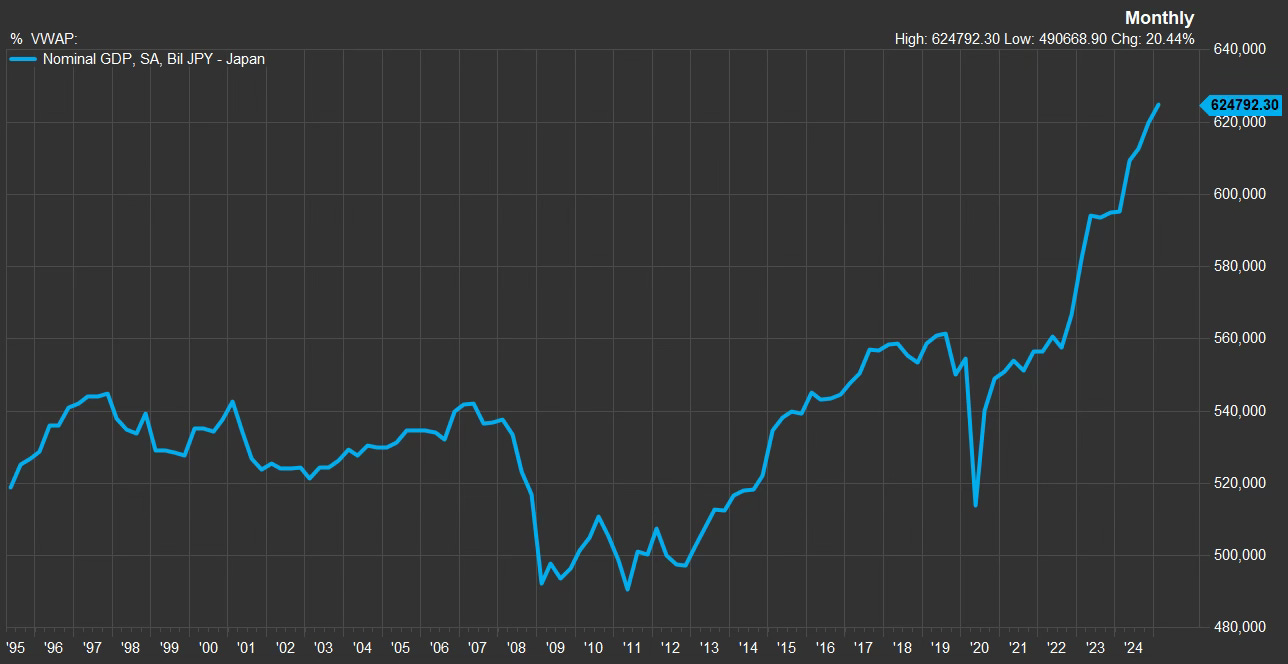
Japan…’the wheelchair economy’ is booming (slide 20).
South Korea is booming (slide 21)
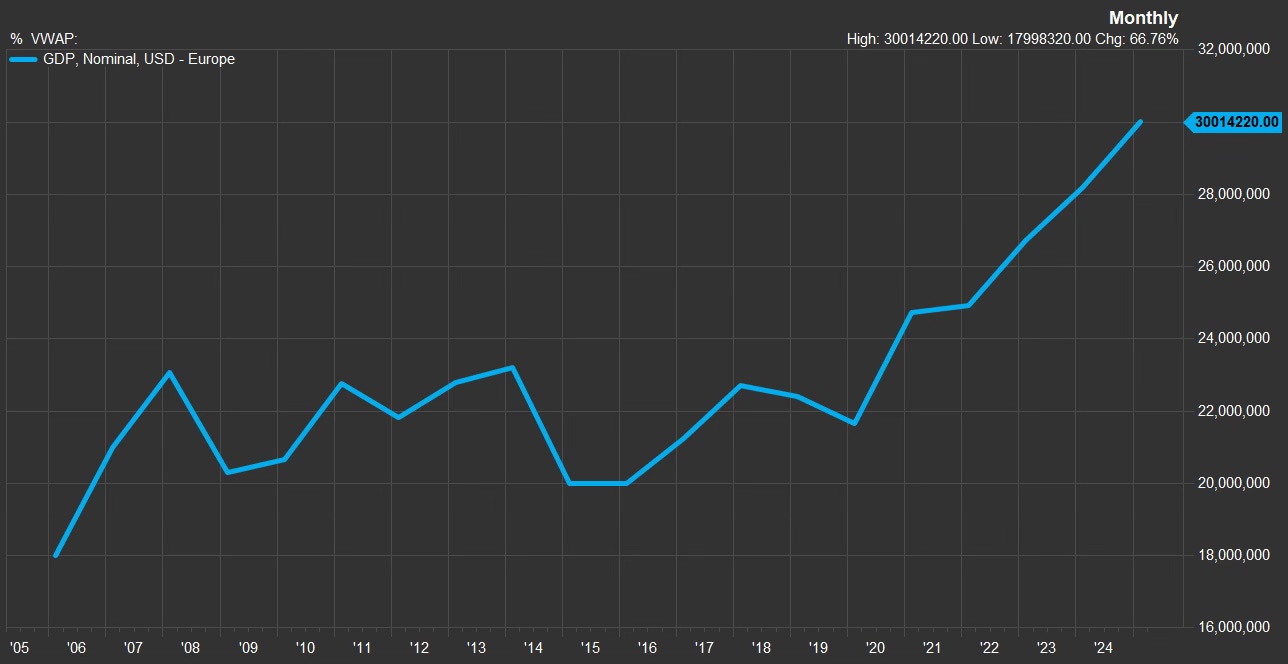
Europe ‘the open air museum’ is booming (slide 19).
And would you believe it? The UK is also booming (slide 22).
Then there is the Chinese Great Depression (slide 25).
The Rest of the World is accelerating (slide 18).
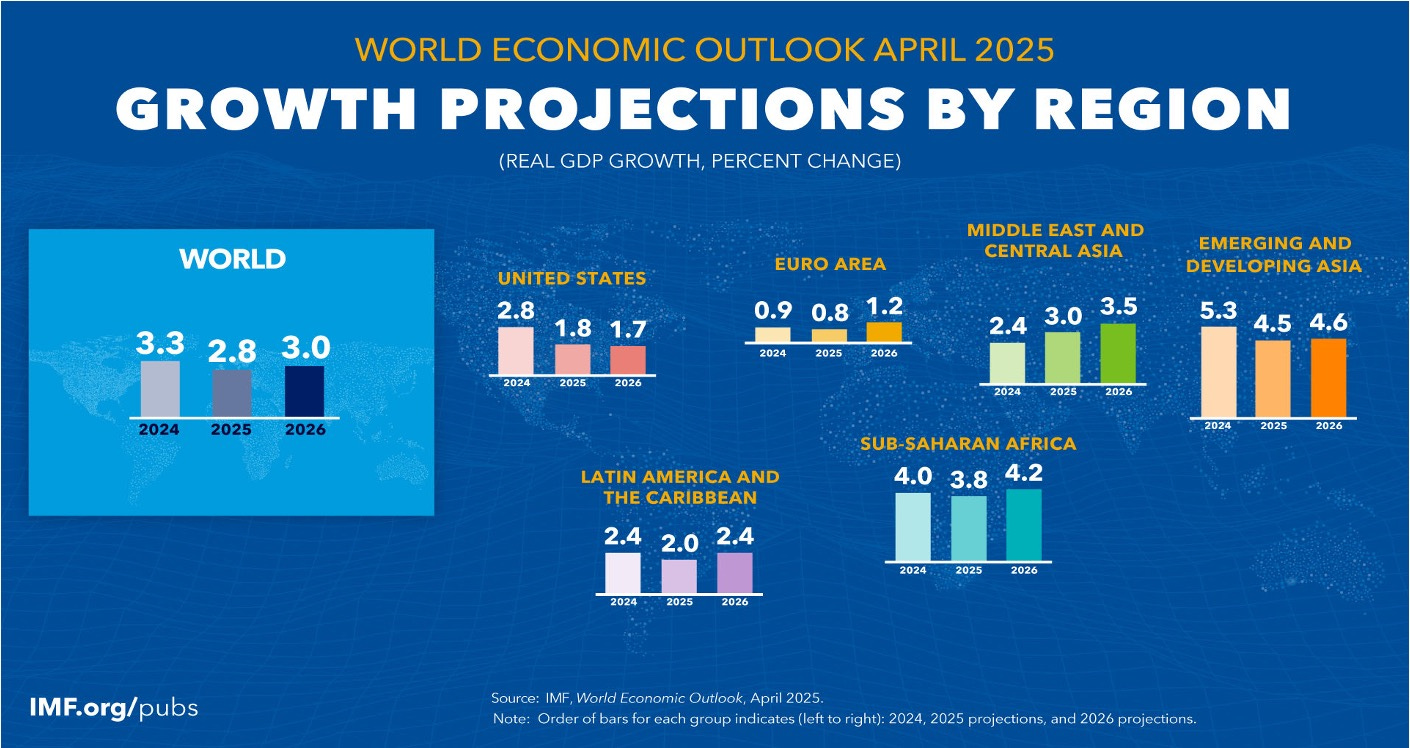
And the US is quite boomy too (slide 23).
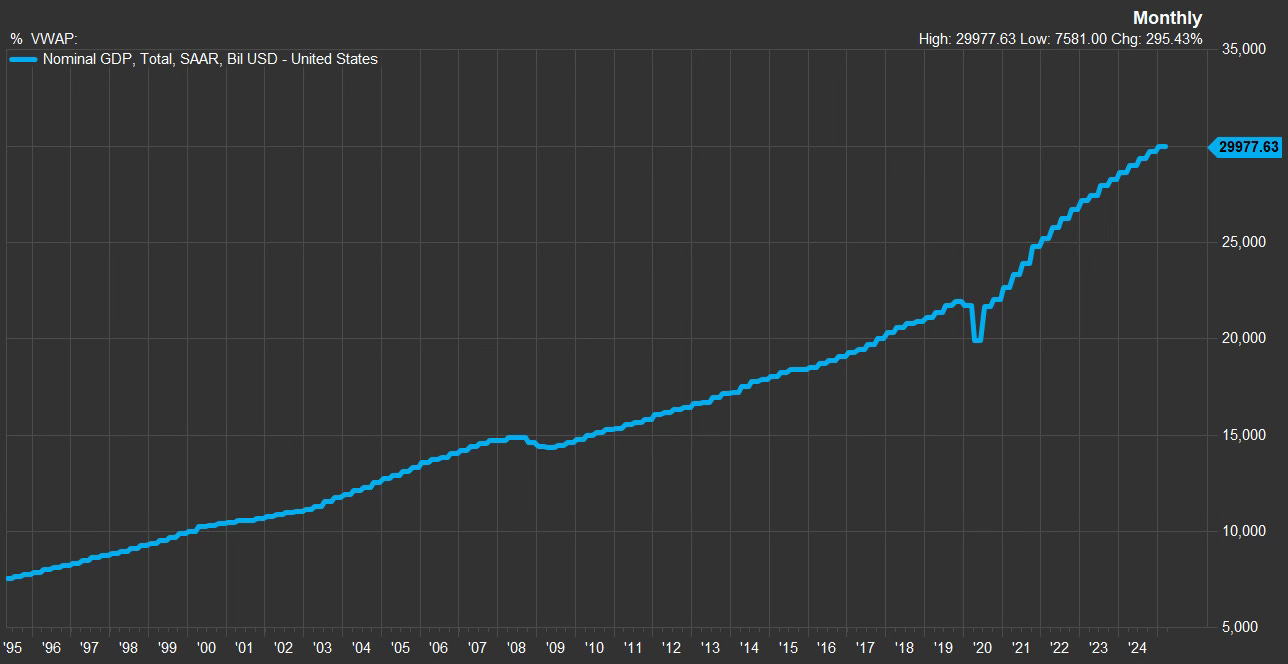
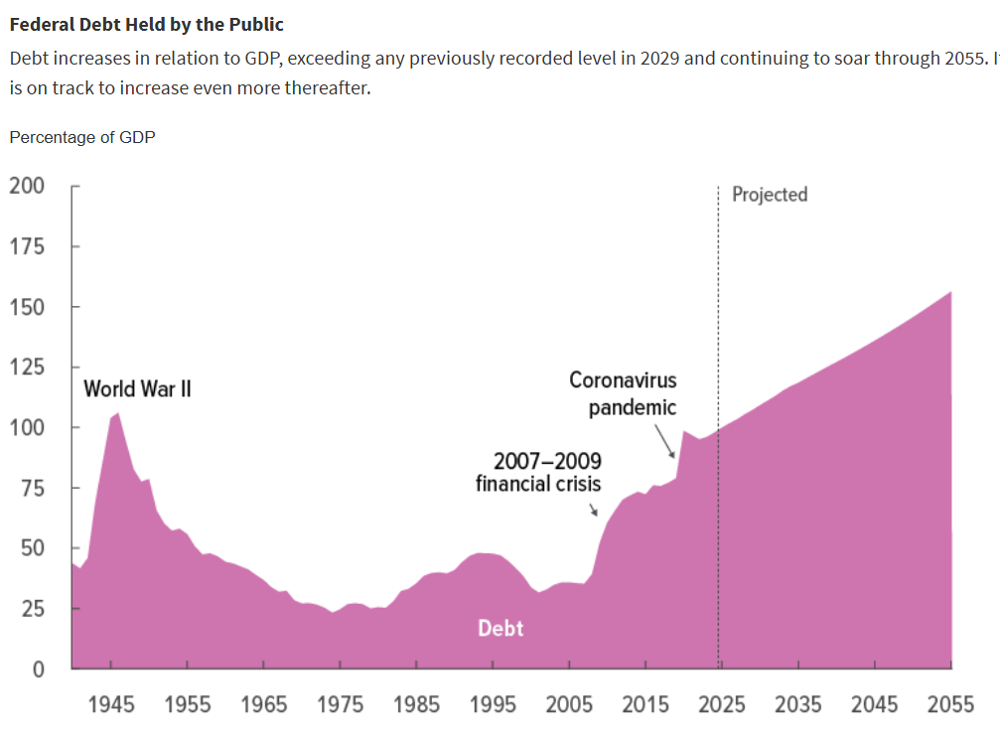
#4 6% Budget Deficits assure us the Booms will continue!
The best thing for a Global Zimbabwe Boom is that governments keep spending. More Money!!!
The CBO is forecasting 6%-7% annal budget deficits through 2055 (slide 28)!!
Which is why this is our favorite chart (slide 27).
The Big Beautiful Bill means even more stimulus (slide 29).
Remember, exploding debt is good. Every $ the US government spends, eventually ends up in the economy as corporate earnings. It’s project Zimbabwe. Government spending is the real printing press. These deficits gives us confidence the booms will continue.
China is also stimulating (slide 30).
While most investors are negative. Some are connecting the dots.
Some are starting to figure out that maybe instead of crashing… we are Booming (slide 24).
“I think the market is way offside on the growth narrative next few months. We just had a huge China pivot and a big easing in financial conditions. Deficits are going to stay elevated everywhere as DOGE underwhelms and Europe is forced to spend more (all growth pos). Focus will turn to the tax bill, which I expect to be stimulative. So I can see growth reaccelerate after a tariff-induced hiccup, all while everyone is waiting for hard data to roll and the systematic community is re-risking. Every macro guy I talk to is bearish and hiding in front-end USTs waiting for that rollover." -- CIO NY
#5 What the 30YR is really telling us
Everyone is chicken littling out about rising 30 year yields in Japan the US, and everywhere (slide 33).
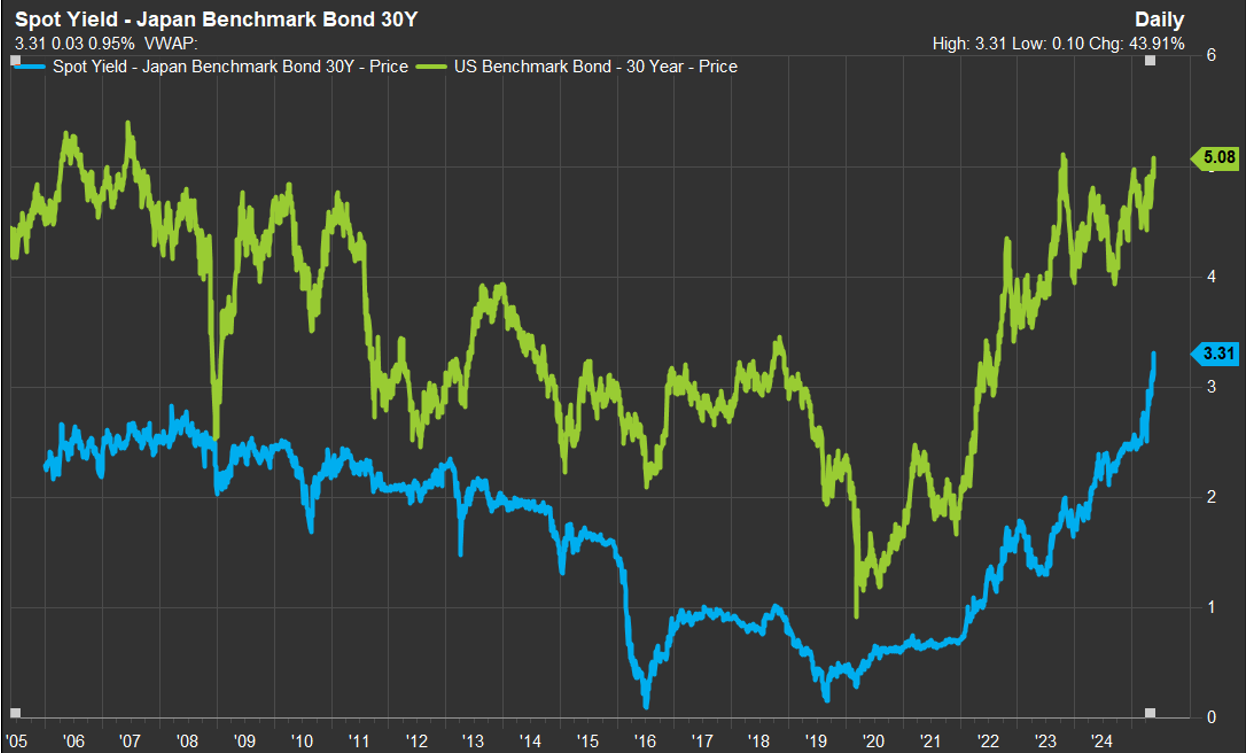
They are worried the bond market is ‘falling out of bed’ and will crash the economy.
No. Flip it 180 degrees.
The 30yr is telling you the the economy is great.
The steepening of the US yield curve (slide 32) is saying the same thing, and has further to go.
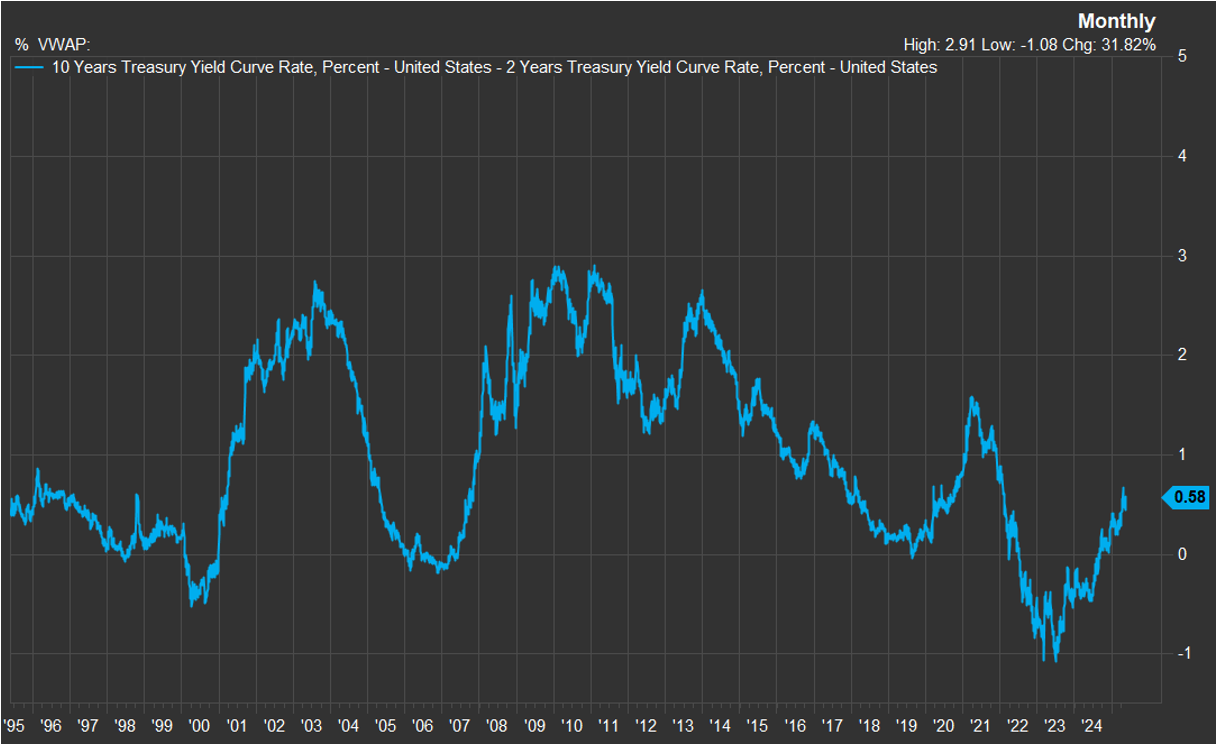
What if the Fed doesn’t cut rates (because of the global boom) and the yield curve steepens to 200bps? You will be looking at 6% US 10 years.
#6 Everyone is in the wrong assets.
Everyone is missing the boom. They are over allocated to US equities and private assets.
US earnings estimates are heavily dominated by tech companies and at the index level the 2025 EPS is sliding (slide 11).
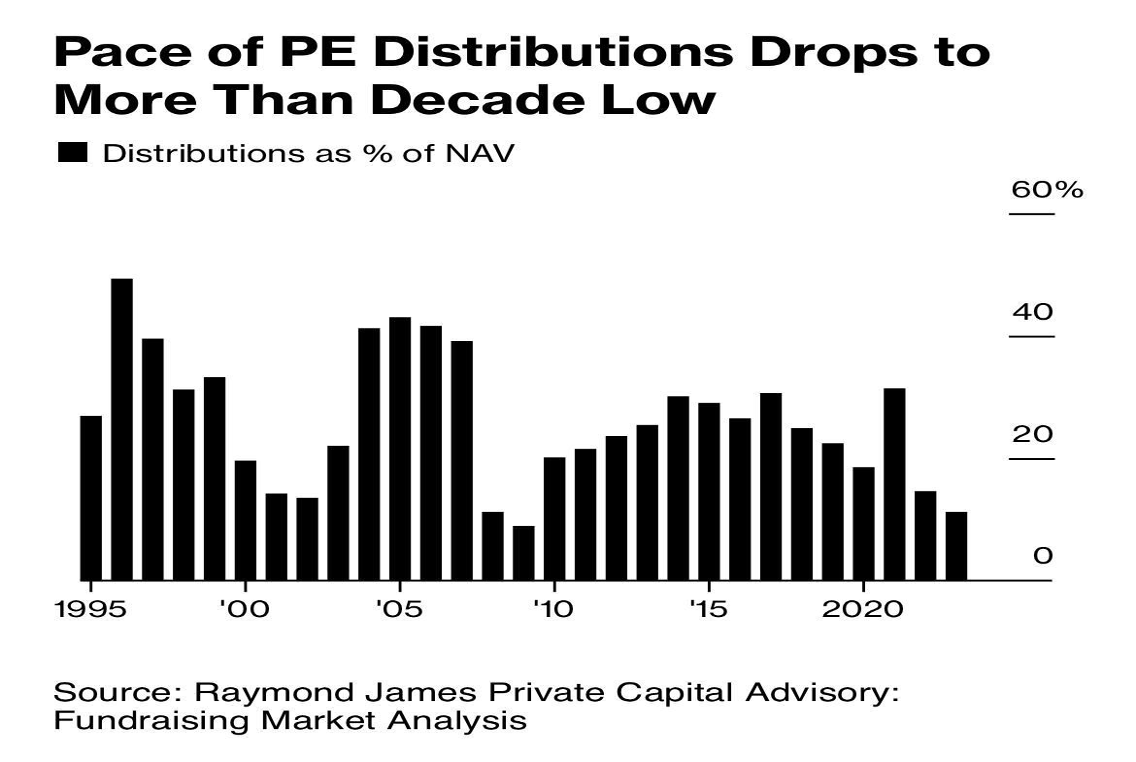
You want to be in undervalued assets which benefit from the global boom and higher nominal inflation, and not in expensive assets that are dependent on leveraging up falling yields (private equity).
The problem for the big institutions is that even if they wanted to allocate to Japan, Korea, Europe and EM they can’t. They have their foot stuck in the private equity trap and can’t get out (slide 39).
Which creates the case for why (potentially) the global boom can last for years. Stocks in the rest of the world go up based on growth and earnings through 2026, but then we get an additional 1-2 year kicker when/if the endowments finally get their money back from their PE/VC funds and pile into international equities for the 8th and 9th inning.
Which is why retail is now the smart money (slide 9).
EPFR data shows the party has barely started. Fund flows into Europe are having the first good year in 10, but China and EM flows haven’t even stated to move (slide 37-38).
So enjoy the global Bull Market and enjoy the bank holiday weekend.
Here is a the link to the full May Killer Chart Pack
