YWR: Global Factor Model
There are two new global trends. We’ve been expecting this, but now the data confirms it.
At the country level it’s the rise of China and at the industry level it’s the gold miners.
But let’s start with the top 40.
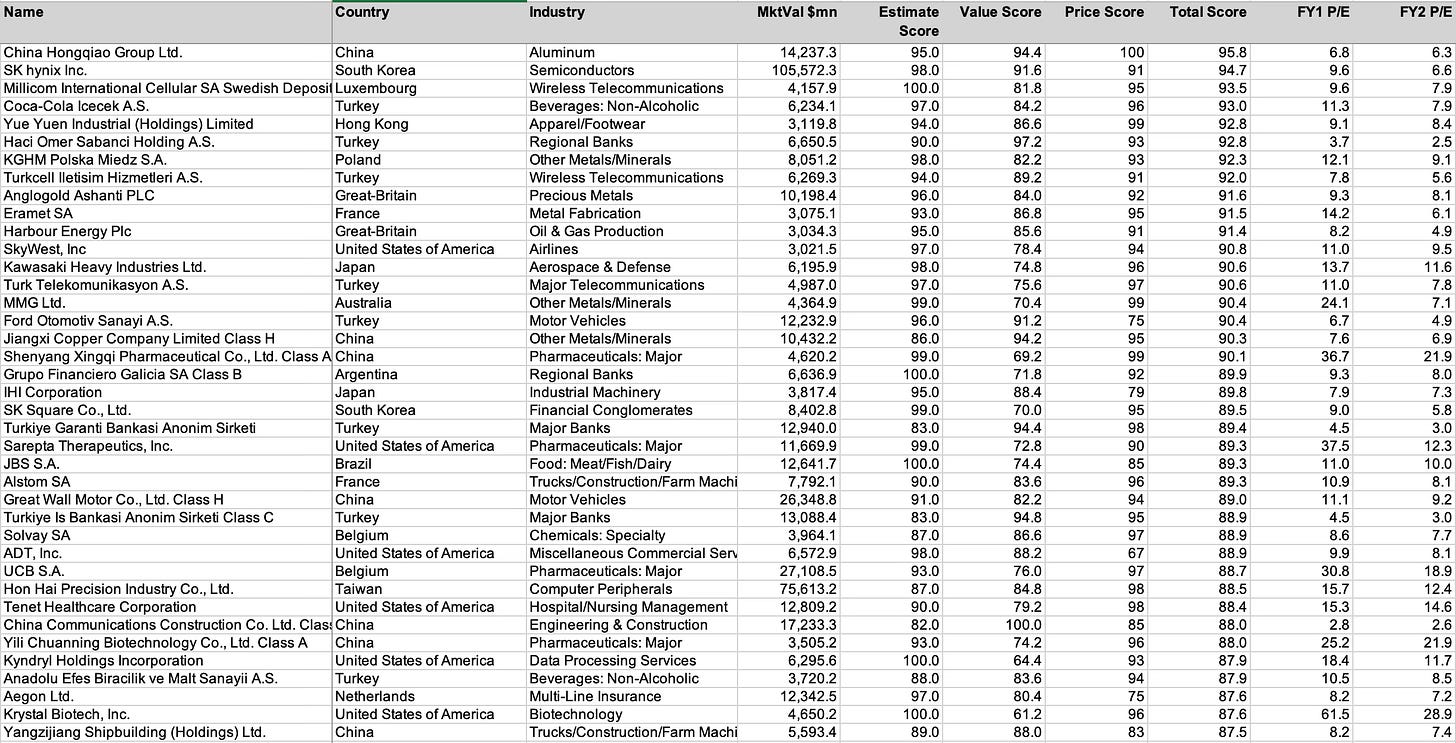
YWR Top 40 Ranked Stocks
As usual Turkey is a standout theme with 8 of the top 40 stocks globally. It’s a market even more hated than China, which makes it especially interesting. We pointed out last month how the TUR ETF looked ready to break out, which happened, but it still looks good.
SK Hynix: The Nvidia of Memory Chips

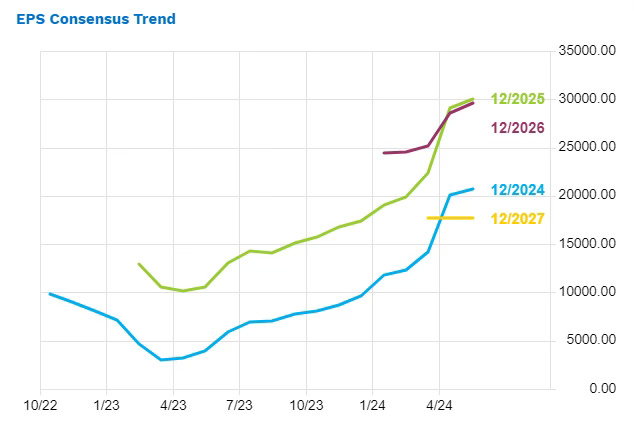
Nvidia’s exclusive provider of memory chips is sold out through 2025 and expects sales to grow at 60% for the next several years, which is interesting because analyst estimates are that we are at peak earnings in 2026 (KRW 30,000/share). The assumption must be that either volumes or memory chip pricing will peak in 2026. Unlike Nvidia, SK Hynix is on 7x forward earnings.
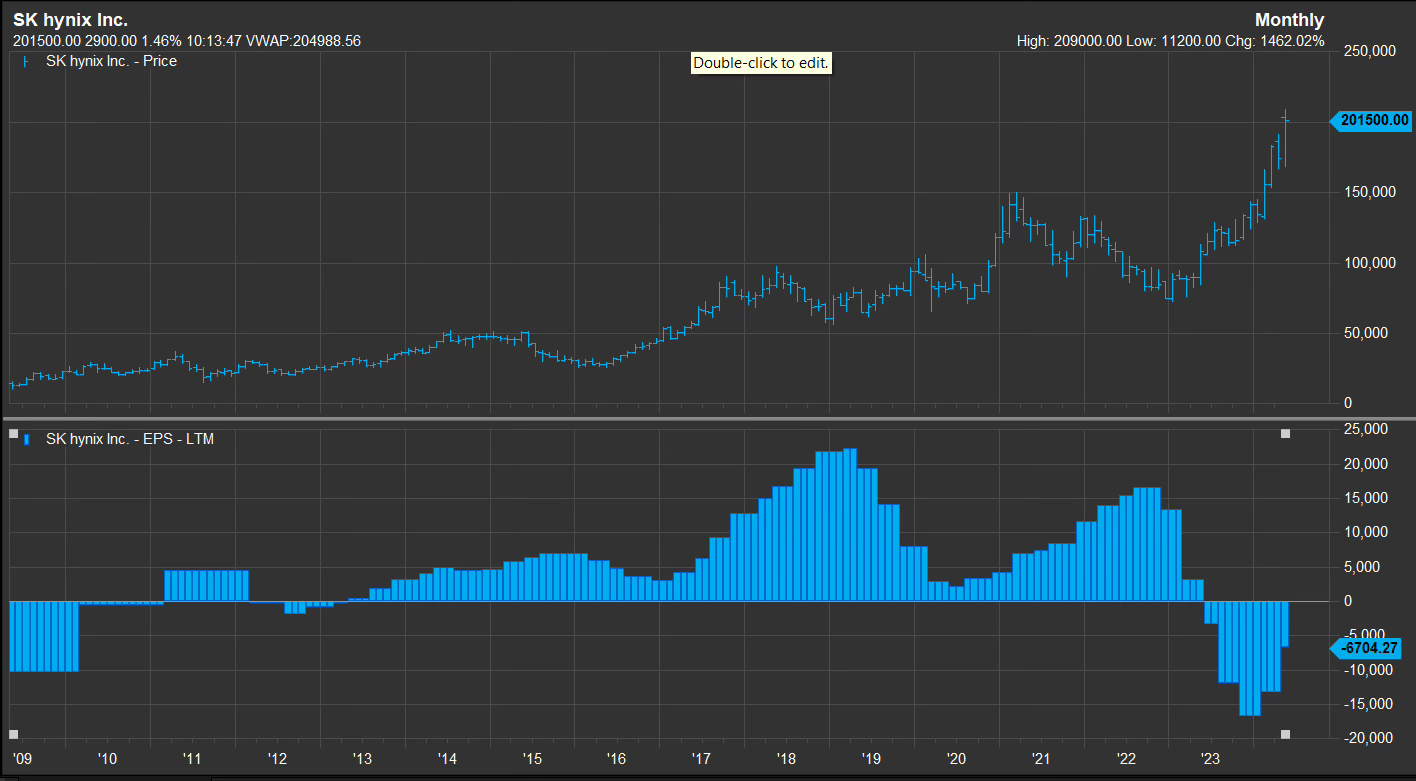
It’s understandable that analysts are skeptical, because things have never been this good for SK Hynix. The top panel is the share price, the bottom is the trailing 12 month EPS.
But SK Hynix must be doing something right because Samsung is furious and sacked their head of semiconductors for falling behind SK Hynix.

Anglogold Ashanti: Good to see Anglogold climbing to #9 on the list. We’ve been bullish on precious metals and the turnaround story at Anglogold.
Industry Trends:
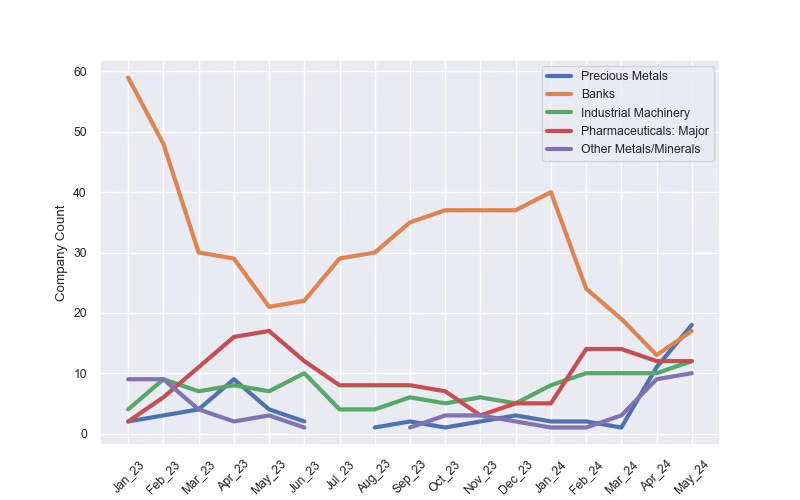
Big upset at the industry level. Banks are out. Gold miners are in. ‘Precious Metals’ is now the most highly represented sector in the YWR Global 300 with 18 stocks. We wrote about the Epic Buy Opportunity in the Gold Miners back in March when gold had its breakout and everyone was sleeping (The Epic Buy Opportunity for Gold and Gold Miners). Two months later the stocks are working, and consensus earnings estimates are rising, so the sector is getting picked up as a top trend in our YWR Global Factor Model. I also like that gold and gold miners are uncorrelated to other sectors of the market, so it could have some insurance value as well.
At the end of the post I’ve provided a link to the full database so you can filter on Precious metals in the Industry column and see what makes the list, but two of our favourites are there (Anglogold and Harmony).
Below you see the monthly trend. Banks used to have the highest momentum by far, but the earnings estimates changes from rising interest rates are no longer as dramatic, and valuations are normalising too, so the sector doesn’t score as well as it used to.
Industrial machinery is another positive trend which includes IHI and Tokyo Electron. Check the database for more because it is a bit varied.
The 5th ranked industry is ‘Other metals’, which is copper (Jiangxi Copper, KGHM and MMG). So we have two mining sectors in the Top 5 industries.
I hadn’t been following the copper portfolio MMG is building, but if you want a diversified copper miner at 7x earnings, this could be your play.
Country Level Trends
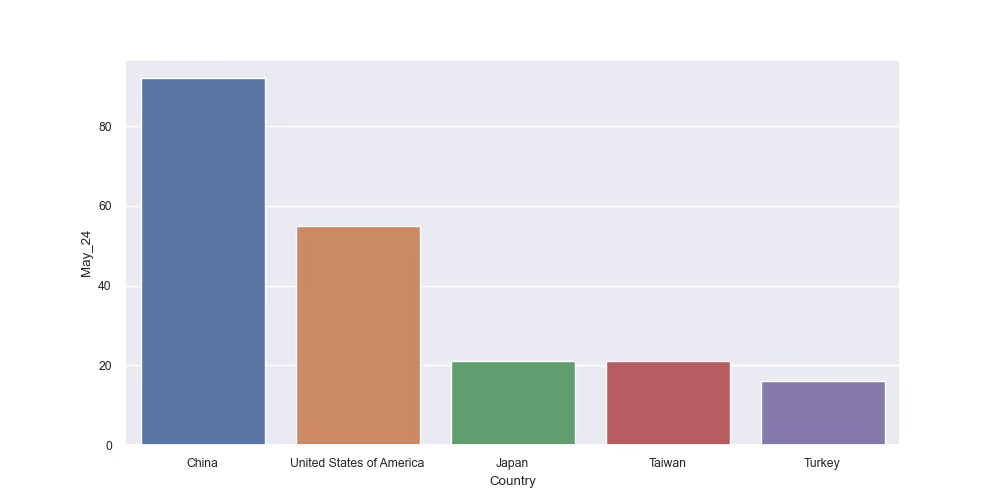
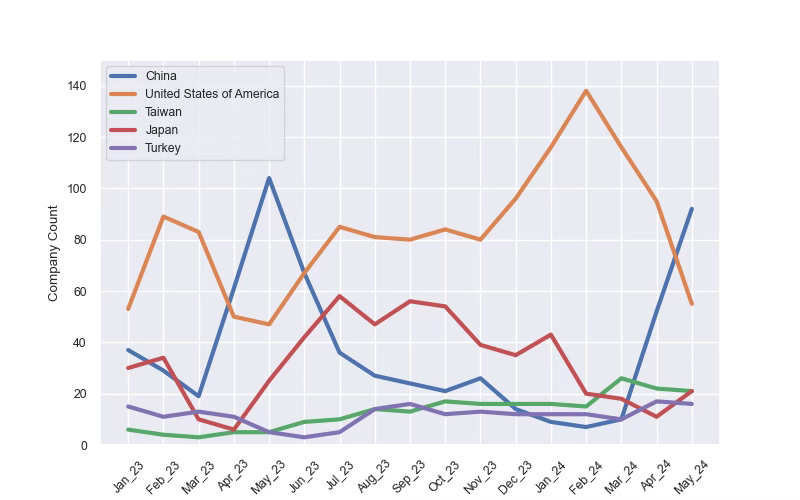
The gold upset is huge at the industry level, but at the country level we have another knockout. China has outed the US as the country with the best combination of earnings momentum, price momentum and valuation.
We’ve been making this call repeatedly that China was going to be the surprise market on 2024 and everyone was underweight (The Surprise Market for 2024, The #1 Trade), but it’s good to see it showing up in the data too.
Unfortunately, the top ranked China names are not companies US investors know well (China Hongqiao Group, Yue Yeun Industrial, Jiangxi Copper, Shenyang Pharma,etc). Which is why we thought it best to play China through the Cash Dragons (Unleash the Cash Dragons), which have ADR’s and which US retail traders know well.
Japan is still a top 5 country and so is Taiwan. My sense is we are underestimating how Taiwan is basically the AI manufacturing hub for the world and there will be many spillovers across the economy for years, which is why it is consistently a top 5 country in the YWR global factor rankings.
At the bottom is a link to the full database, so feel free to sort and filter on the different factor rankings and valuations.
Looking for some REIT’s in the wreckage.
In last weekend’s YWR Killer Chart pack we saw investors in the BofA survey are apocalyptic on REIT’s. They haven’t been this negative since 2009, which means we probably should be buying something.
I’ve also built some Tableau dashboards to help visualise the YWR rankings data better at an industry level.
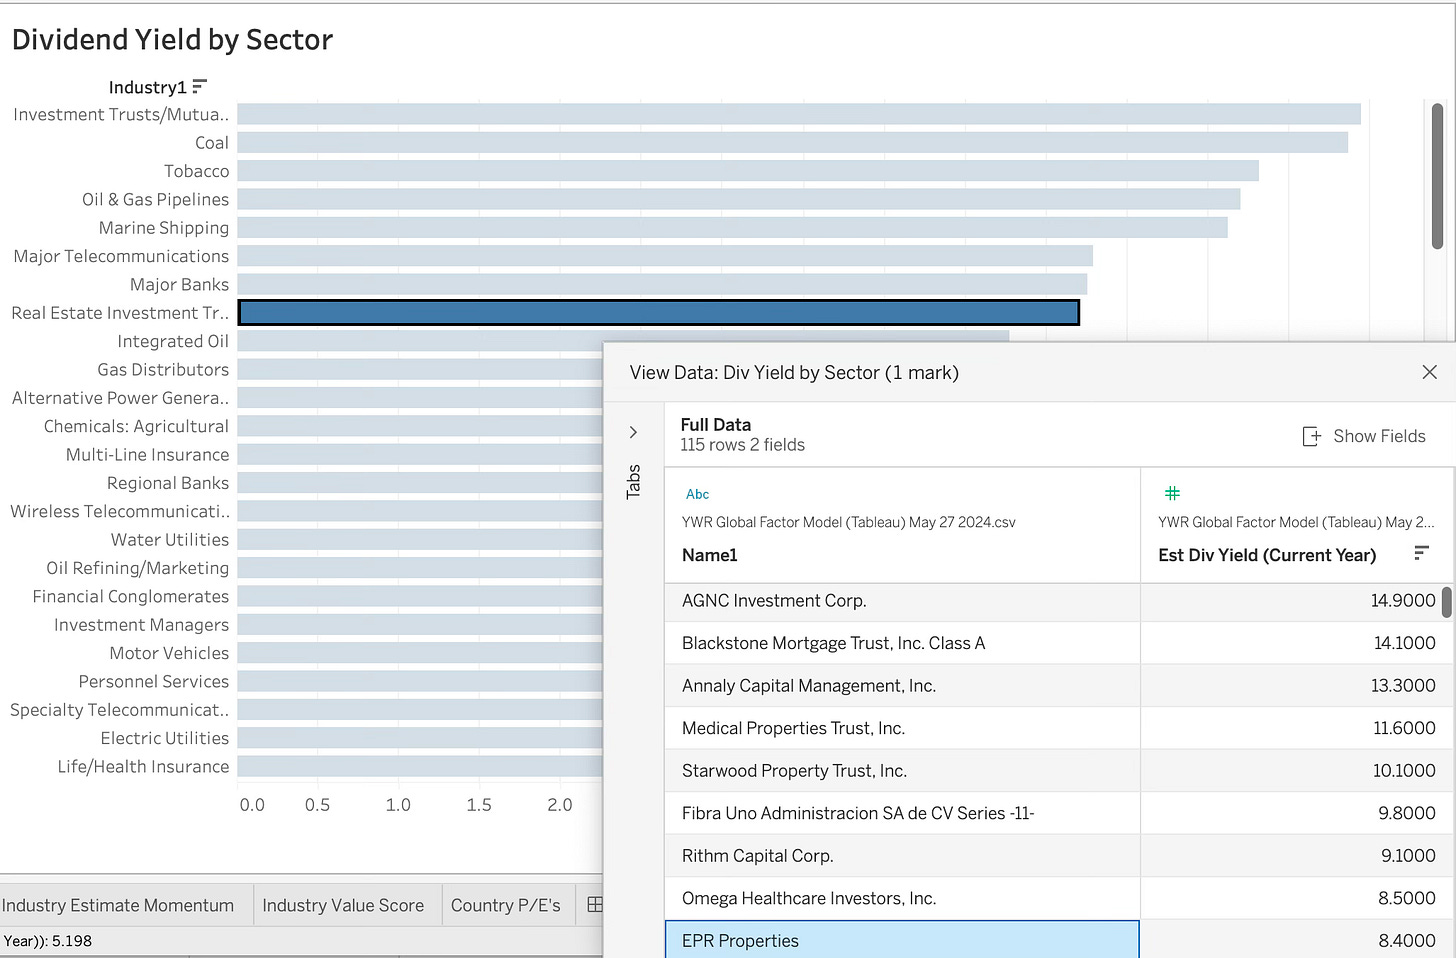
When we look into the Tableau dashboard of top dividend yielding sectors globally it is Coal, Tobacco, Pipelines, Telcos, Banks then REIT’s. But within REIT’s it is the levered mortgage trusts which are especially juicy (AGNC, Blackstone Mortgage and Annaly).
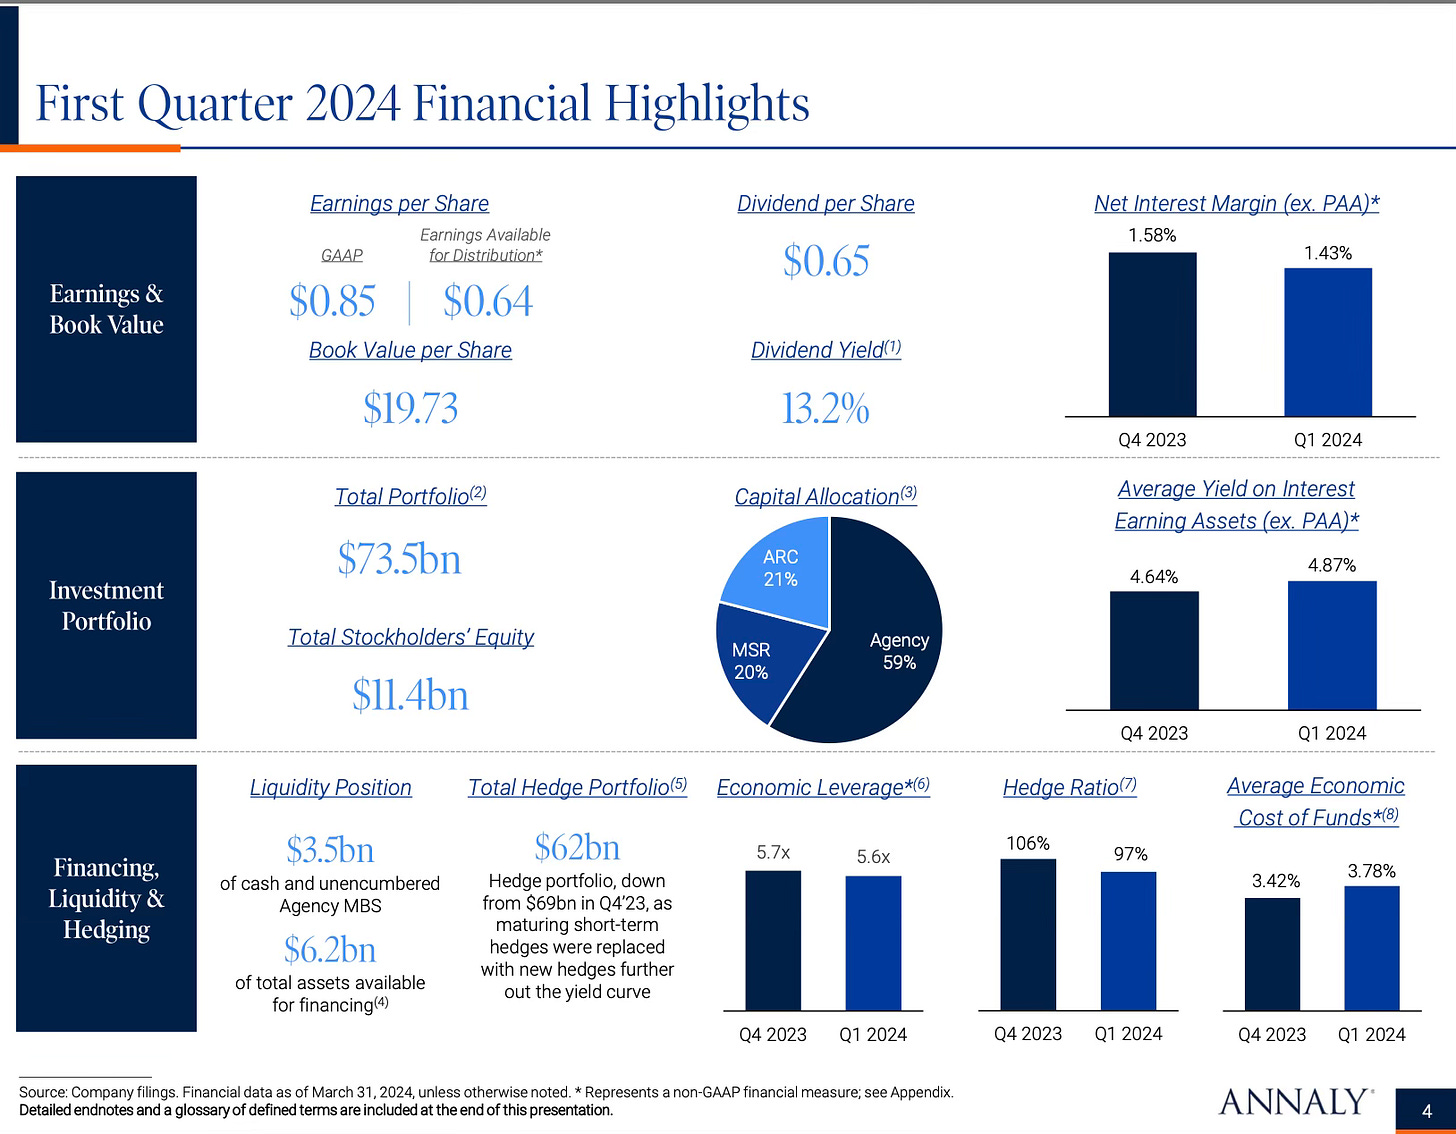
Annaly has a 13.3% dividend yield from investing in residential mortgages, 59% of which are Agency MBS.
Below are links to the May 2024 database of YWR stock rankings for over 3,000 stocks as well as the Tableau dashboards.


