YWR: Your Weekend Reading

YWR: Your Weekend Reading

YWR: Global Factor Model

Erik's avatar
Erik
Oct 31, 2026
∙ Paid

I know it’s been a hectic week.

But let’s stick to our monthly discipline and review the global estimate trends. It’s good to know.

I think you’ll find they are better than you expect.

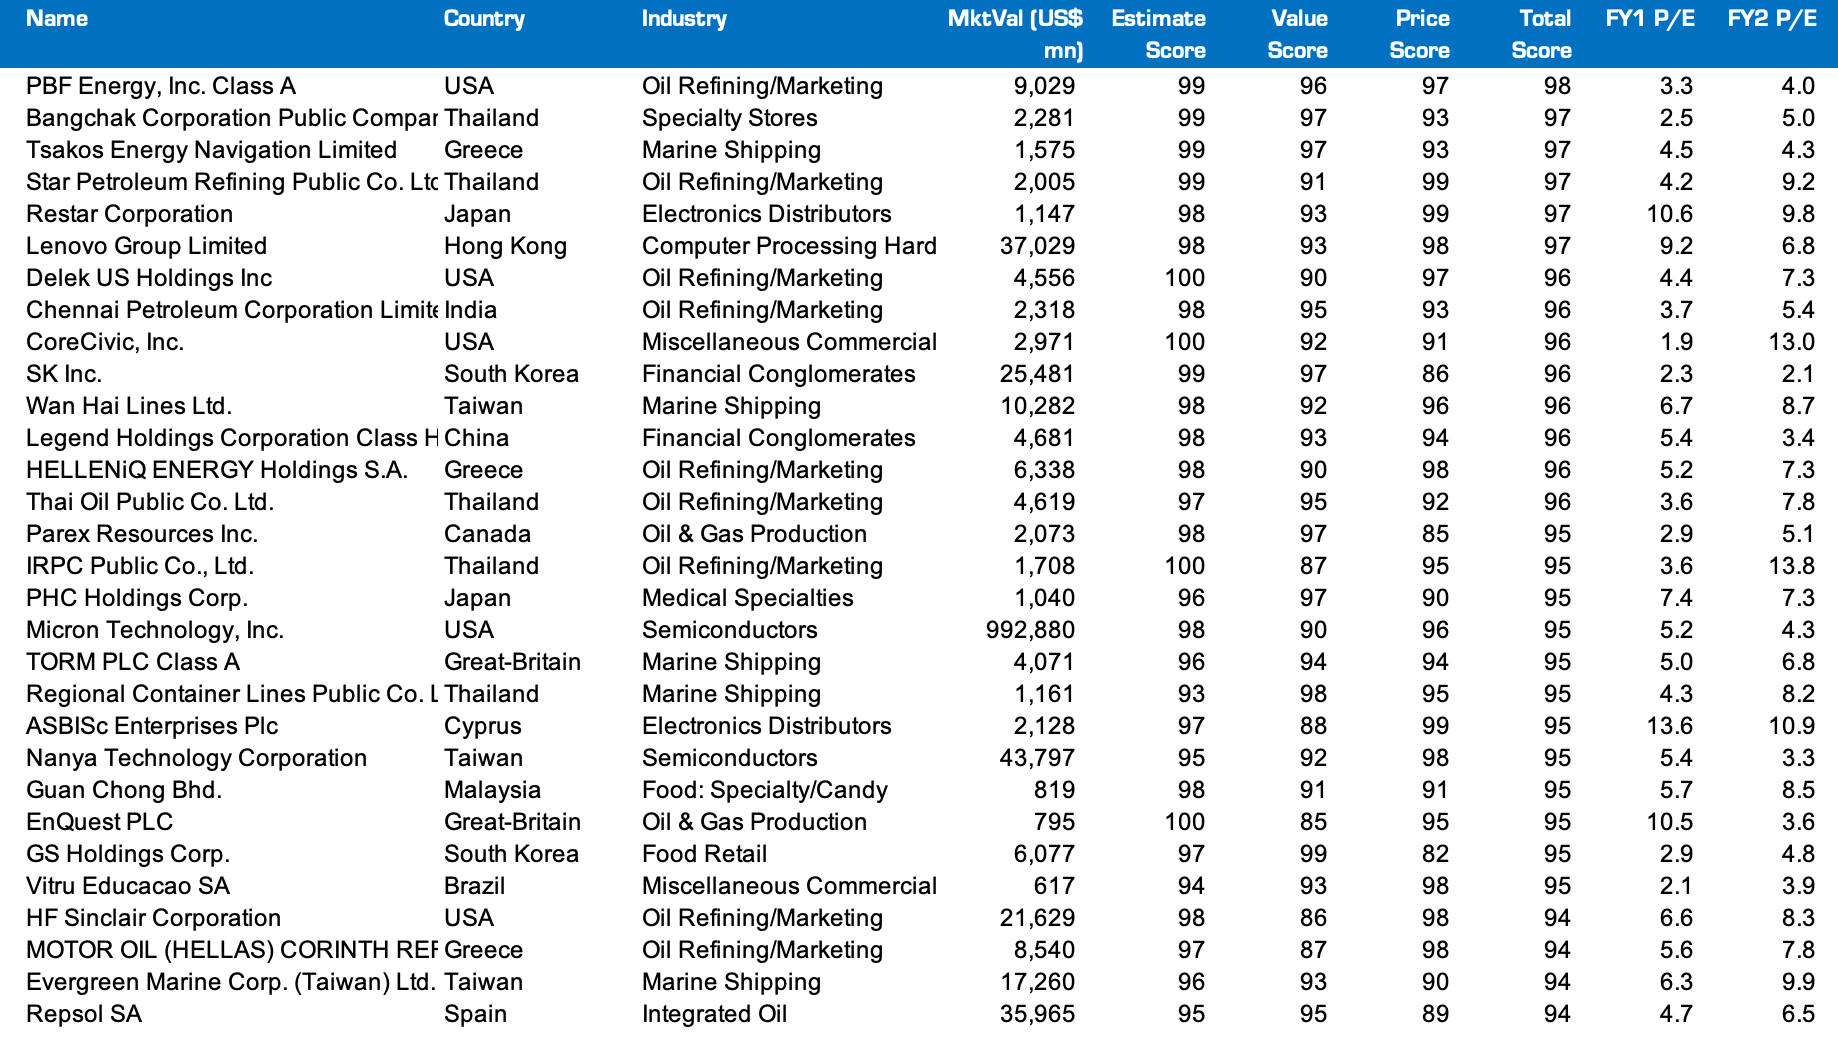
As a reminder the Global Factor Model is where we rank over 10,000 stocks on earnings estimate revisions, valuations and price momentum.

We are searching the world for the best combination of positive earnings revisions and attractive valuations.

At the bottom of the post are links to:

  • The October Factor Model Sheet with rankings on over 10,000 global stocks.

  • The YWR Factor Model Data App with rankings and earnings revision charts.

YWR Global Top 30
Name 
Country 
Industry 
MktVal [US$ 
Estimate 
Value 
Price 
Total 
FY1 P/E FY2 P/E 
mn] 
Score 
Score 
Score 
Score 
PBF Energy, Inc. Class A 
USA 
Oil Refining/Marketing 
9,029 
99 
96 
97 
98 
3.3 
4.0 
Bangchak Corporation Public Compar Thailand 
Specialty Stores 
2,281 
99 
97 
93 
97 
2.5 
5.0 
Tsakos Energy Navigation Limited 
Greece 
Marine Shipping 
1,575 
99 
97 
93 
97 
4.5 
4.3 
Star Petroleum Refining Public Co. Ltc Thailand 
Oil Refining/Marketing 
2,005 
99 
91 
99 
97 
4.2 
9.2 
Restar Corporation 
Japan 
Electronics Distributors 
1,147 
98 
93 
99 
97 
10.6 
9.8 
Lenovo Group Limited 
Hong Kong 
Computer Processing Hard 
37,029 
98 
93 
98 
97 
9.2 
6.8 
Delek US Holdings Inc 
USA 
Oil Refining/Marketing 
4,556 
100 
90 
97 
96 
4.4 
7.3 
Chennai Petroleum Corporation Limite India 
Oil Refining/Marketing 
2,318 
98 
95 
93 
96 
3.7 
5.4 
CoreCivic, Inc. 
USA 
Miscellaneous Commercial 
2,971 
100 
92 
91 
96 
1.9 
13.0 
SK Inc. 
South Korea 
Financial Conglomerates 
25,481 
99 
97 
86 
96 
2.3 
2.1 
Wan Hai Lines Ltd. 
Taiwan 
Marine Shipping 
10,282 
98 
92 
96 
96 
6.7 
8.7 
Legend Holdings Corporation Class H China 
Financial Conglomerates 
4,681 
98 
93 
94 
96 
5.4 
3.4 
HELLENiQ ENERGY Holdings S.A. 
Greece 
Oil Refining/Marketing 
6,338 
98 
90 
98 
96 
5.2 
7.3 
Thai Oil Public Co. Ltd. 
Thailand 
Oil Refining/Marketing 
4,619 
97 
95 
92 
96 
3.6 
7.8 
Parex Resources Inc. 
Canada 
Oil & Gas Production 
2,073 
98 
97 
85 
95 
2.9 
5.1 
IRPC Public Co., Ltd. 
Thailand 
Oil Refining/Marketing 
1,708 
100 
87 
95 
95 
3.6 
13.8 
PHC Holdings Corp. 
Japan 
Medical Specialties 
1,040 
96 
97 
90 
95 
7.4 
7.3 
Micron Technology, Inc. 
USA 
Semiconductors 
992,880 
98 
90 
96 
95 
5.2 
4.3 
TORM PLC Class A 
Great-Britain 
Marine Shipping 
4,071 
96 
94 
94 
95 
5.0 
6.8 
Regional Container Lines Public Co. L Thailand 
Marine Shipping 
1,161 
93 
98 
95 
95 
4.3 
8.2 
ASBISc Enterprises Plc 
Cyprus 
Electronics Distributors 
2,128 
97 
88 
99 
95 
13.6 
10.9 
Nanya Technology Corporation 
Taiwan 
Semiconductors 
43,797 
95 
92 
98 
95 
5.4 
3.3 
Guan Chong Bhd. 
Malaysia 
Food: Specialty/Candy 
819 
98 
91 
91 
95 
5.7 
8.5 
EnQuest PLC 
Great-Britain 
Oil & Gas Production 
795 
100 
85 
95 
95 
10.5 
3.6 
GS Holdings Corp. 
South Korea 
Food Retail 
6,077 
97 
99 
82 
95 
2.9 
4.8 
Vitru Educacao SA 
Brazil 
Miscellaneous Commercial 
617 
94 
93 
98 
95 
2.1 
3.9 
HF Sinclair Corporation 
USA 
Oil Refining/Marketing 
21,629 
98 
86 
98 
94 
6.6 
8.3 
MOTOR OIL (HELLAS) CORINTH REF Greece 
Oil Refining/Marketing 
8,540 
97 
87 
98 
94 
5.6 
7.8 
Evergreen Marine Corp. (Taiwan) Ltd. Taiwan 
Marine Shipping 
17,260 
96 
93 
90 
94 
6.3 
9.9 
Repsol SA 
Spain 
Integrated Oil 
35,965 
95 
95 
89 
94 
4.7 
6.5

The Two Big Trends

There are two major trends in the market right now.

One trend you debate and talk about all the time.

Then another trend.

A trend you don’t like, don’t want to talk about, and don’t own.

The trend we debate all the time is AI, Semiconductors and the related supply chain. Estimate revisions for companies in the semiconductor supply chain are some of the strongest in the world. Many of these are based in Taiwan and Japan. These are Restar, Lenovo, Micron, Winbond Electronics, Nanya Tech, Asustek, Penguin Solutions and United Microelectronics.

Micron and Lenovo Earnings Estimates

The second major estimate trend; the one we don’t want to talk about is everything related to the Energy Crisis. It’s shipping, refiners, and integrated oil. This is a difficult theme because no one has a view on where the Iran War is going (Hormuz 2030).

Estimates for these companies all have an interesting feature. Estimates are rising with strong earnings for 2026, but then lower in 2027 because the war will be over and oil prices, refining margins and shipping rates will fall back to ‘normal’ levels. Right?

Earnings estimate revisions for PBF, Repsol and TORM

Top 5 Ranked Sectors

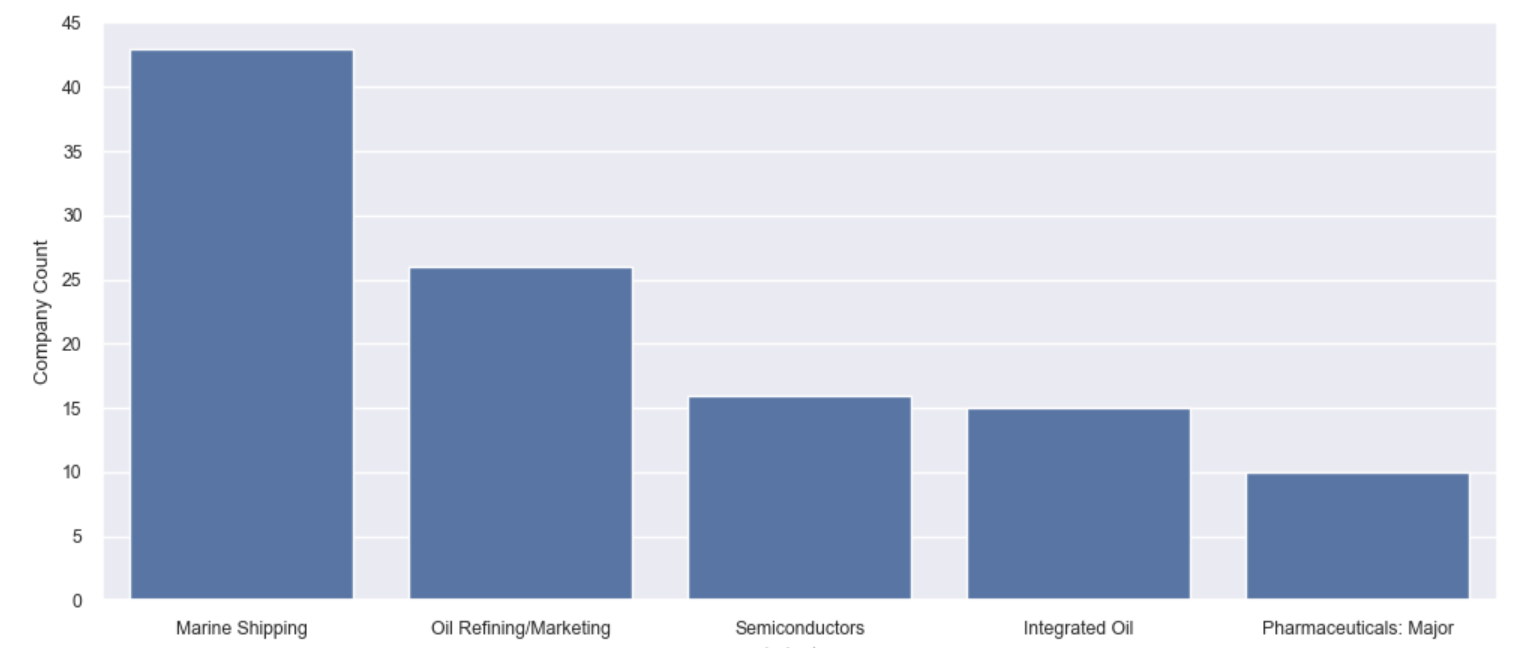
The top 5 best ranked sectors in the world are Shipping, Refining, Semiconductors, Integrated Oil and Pharmaceuticals. On Pharmaceuticals most of these are Chinese stocks. The best ranked pharmaceutical company listed in the US is Regeneron.
Cleveland Cliffs

Have you seen US steel prices? They are over $1,400/ton.

It’s a mix of things. Strong demand for steel in the US, tariffs on imported steel and lately the high cost of shipping steel to the US.

But it’s good if you happen to own steel plants in the US and have been accumulating them for years, like Cleveland Cliffs.

HRC, CLF_EPS estimates and Price Chart

Earnings estimates for CLF are rising and the stock price hasn't moved much, which is an interesting set up.

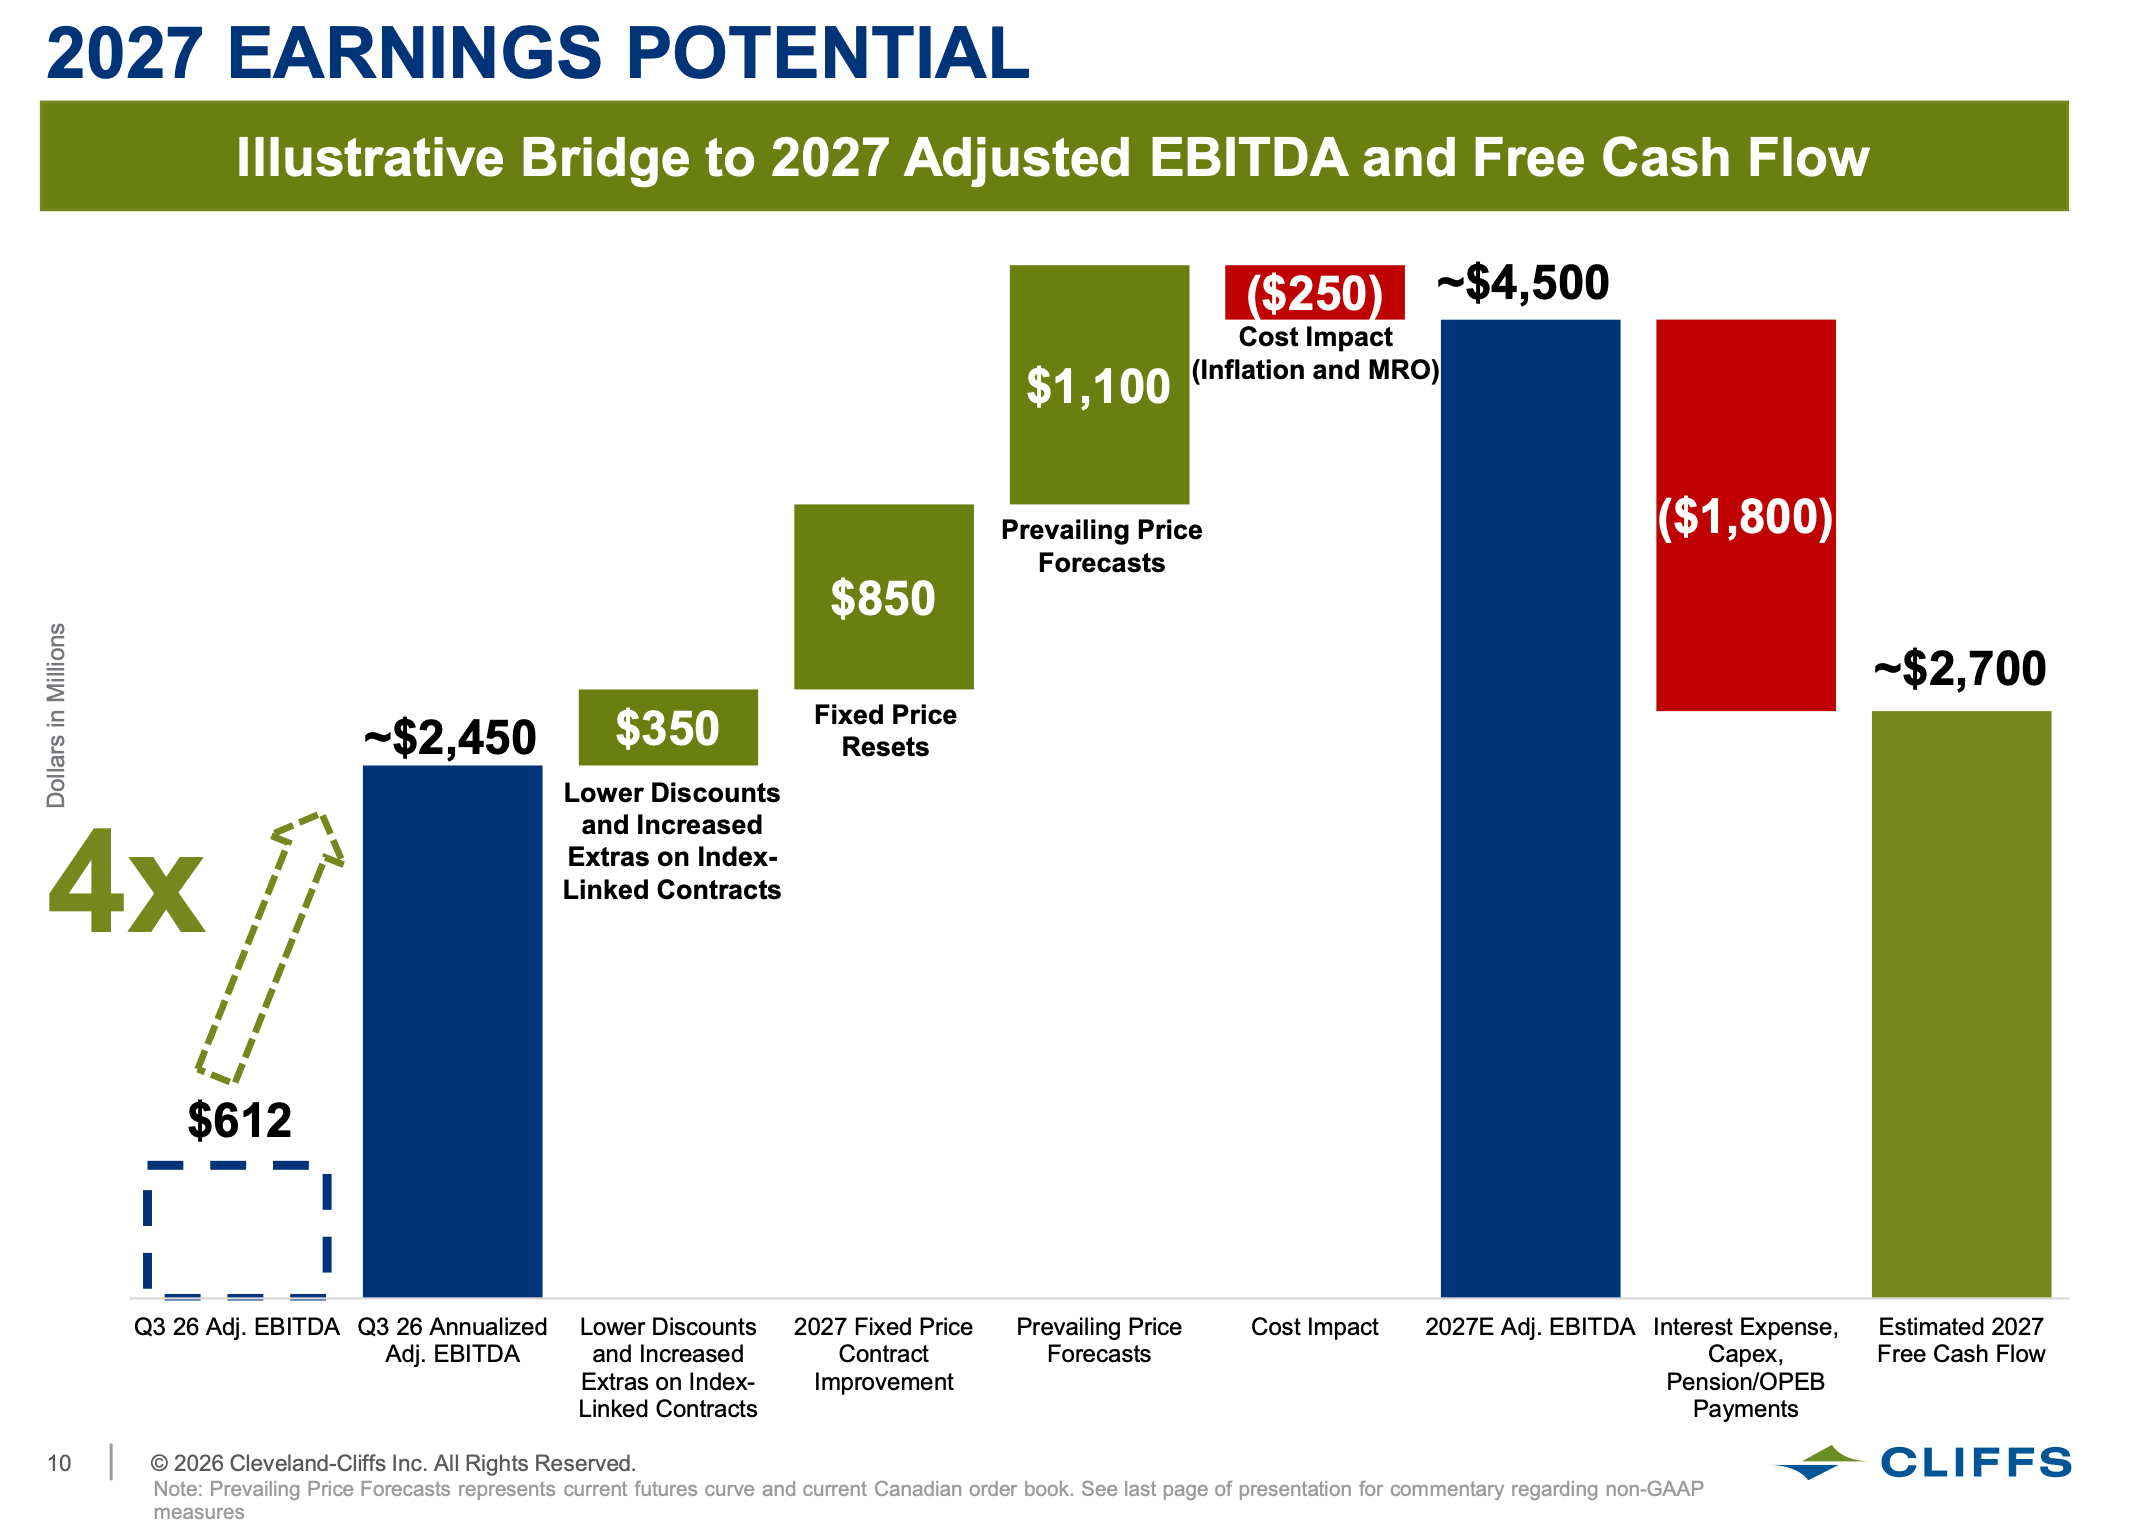
If you are wondering what CLF could earn next year after their contracts reprice closer to spot prices, the company spells it out for you. It’s about $2.7 billion in estimated free cash flow, which puts CLF (Market Cap $8.1bn) on 3x 2027 estimated cash flow.
2027 EARNINGS POTENTIAL 
Illustrative Bridge to 2027 Adjusted EBITDA and Free Cash Flow 
($250) 
~$4,500 
Cost Impact 
$1,100 
(Inflation and MRO) 
Prevailing Price 
$850 
Forecasts 
~$2,700 
~$2,450 
$350 
Fixed Price 
Resets 
Lower Discounts 
Dollars in Millions 
4x 
and Increased 
Extras on Index- 
Linked Contracts 
$612 
Q3 26 Adj. EBITDA Q3 26 Annualized 
Lower Discounts 
2027 Fixed Price 
Prevailing Price 
Cost Impact 
2027E Adj. EBITDA Interest Expense, 
Estimated 2027 
Adj. EBITDA 
and Increased 
Contract 
Forecasts 
Free Cash Flow 
Extras on Index- 
Linked Contracts 
Improvement 
Payments 
- 
10 
2026 Cleveland-Cliffs Inc. All Rights Reserved. 
CLIFFS 
Note: Prevailing Price Forecasts represents current futures curve and current Canadian order book. See last page of presentation for commentary regarding non-GAAP 
measures

But my guess is refiners, shipping, energy and steel aren’t what you are focused on.

Everyone is scrutinising the latest earnings for big cap US tech.

US Big Cap Estimate Revision Review

We can go round and round on AI and whether OpenAI and Anthropic will make money, etc, etc, but so far earnings trends for the largest companies in the world are positive. Maybe a little weakness in Meta, but otherwise forward estimates are trending upwards for the large stocks.

US Large Cap Earnings Estimate

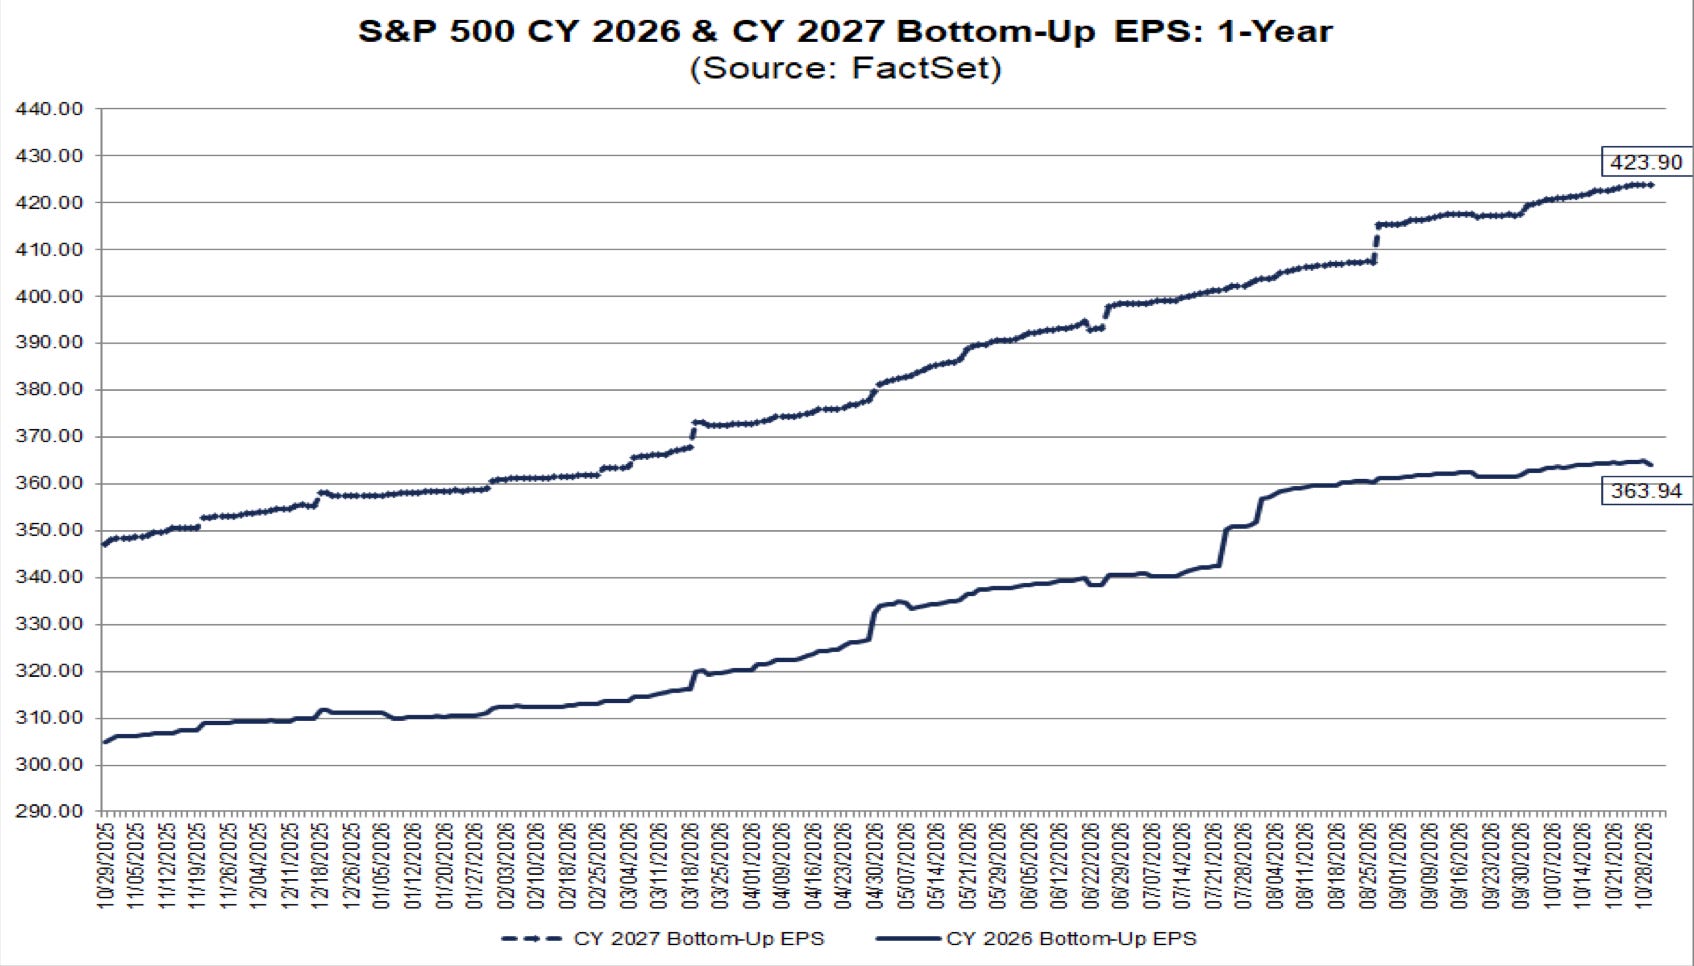
Over 60% of companies have reported Q3 results and estimates for the S&P 500 as a whole are trending upwards.
Below are links to the rankings sheet so you can screen through all the stocks.

There is also the data app, which I like a lot because a quick click on any stock shows the earnings estimates for FY1, FY2 and FY3.

User's avatar

Continue reading this post for free, courtesy of Erik.

Or purchase a paid subscription.
© 2026 YWR · Privacy ∙ Terms ∙ Collection notice
Start your SubstackGet the app
Substack is the home for great culture