
YWR: Global Factor Model

There is a new estimate trend.
And it dominates everything.
One trend to rule them all.
But let’s do this by the books and start with the top 30 stocks in the world ranked by our combination of earnings estimate revisions, valuation and price momentum.
Links to all of our tools and dashboards are at the bottom of the post.
YWR Global Top 30
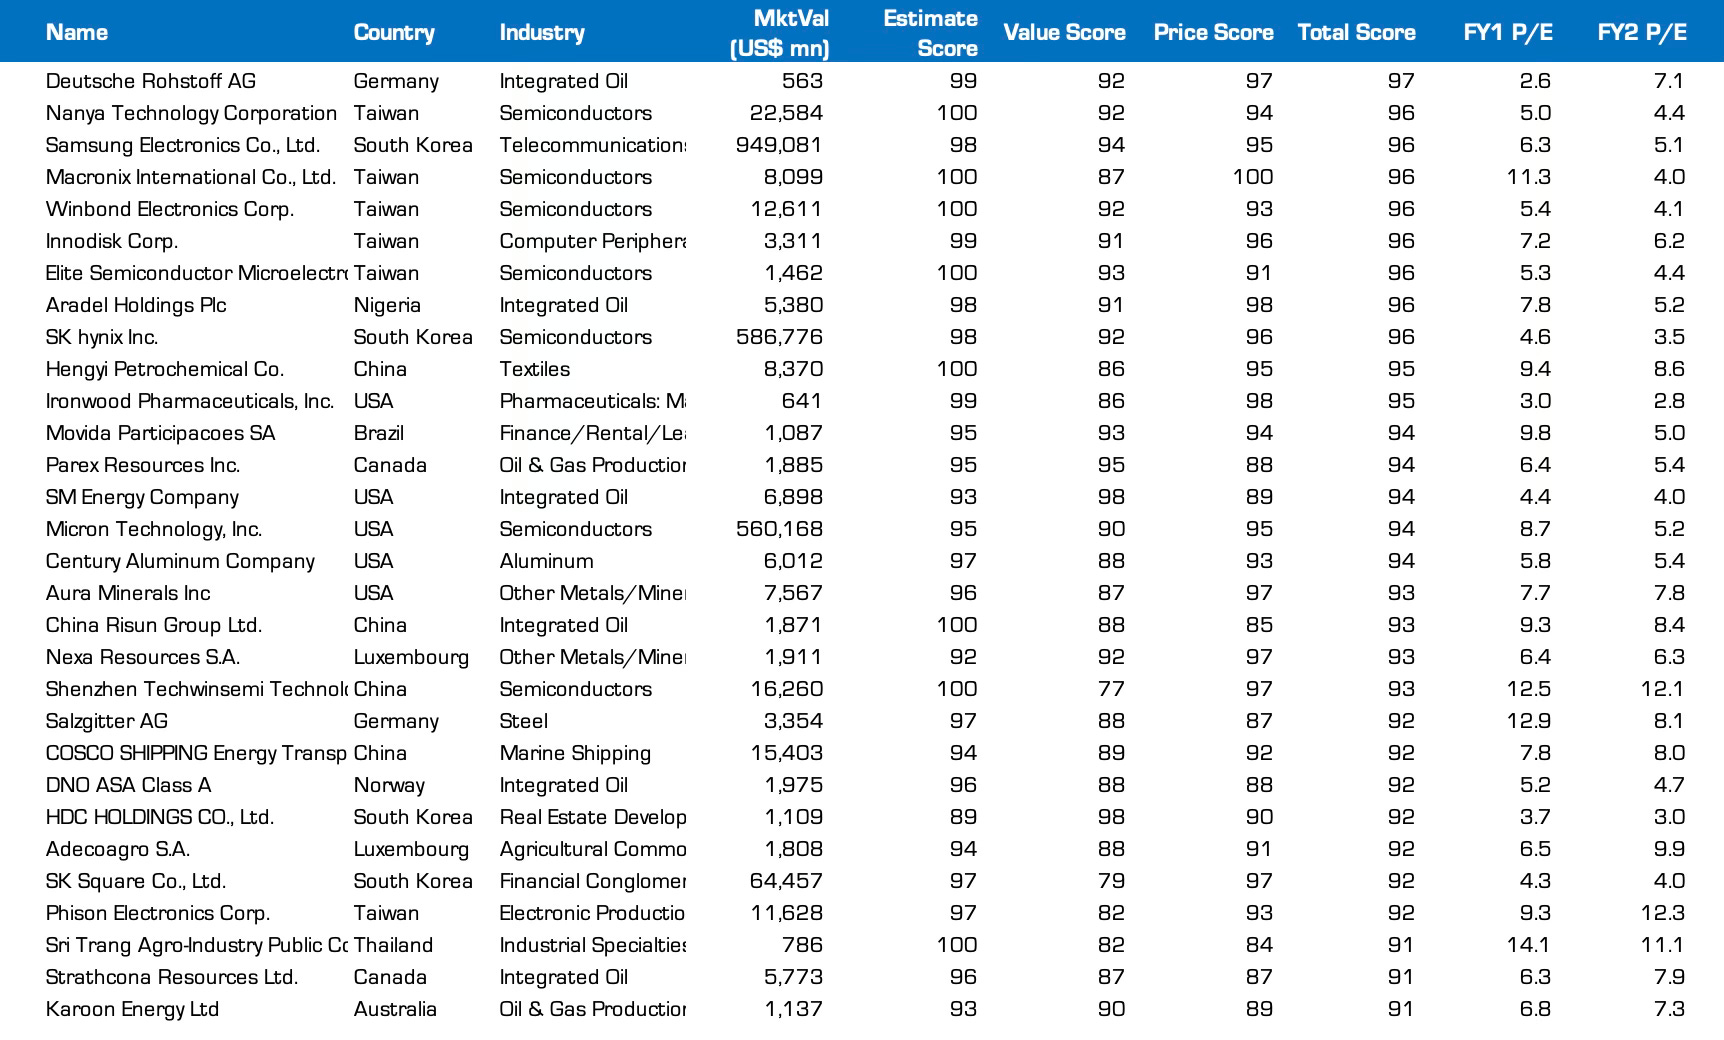
Most of the earlier trends still exist.
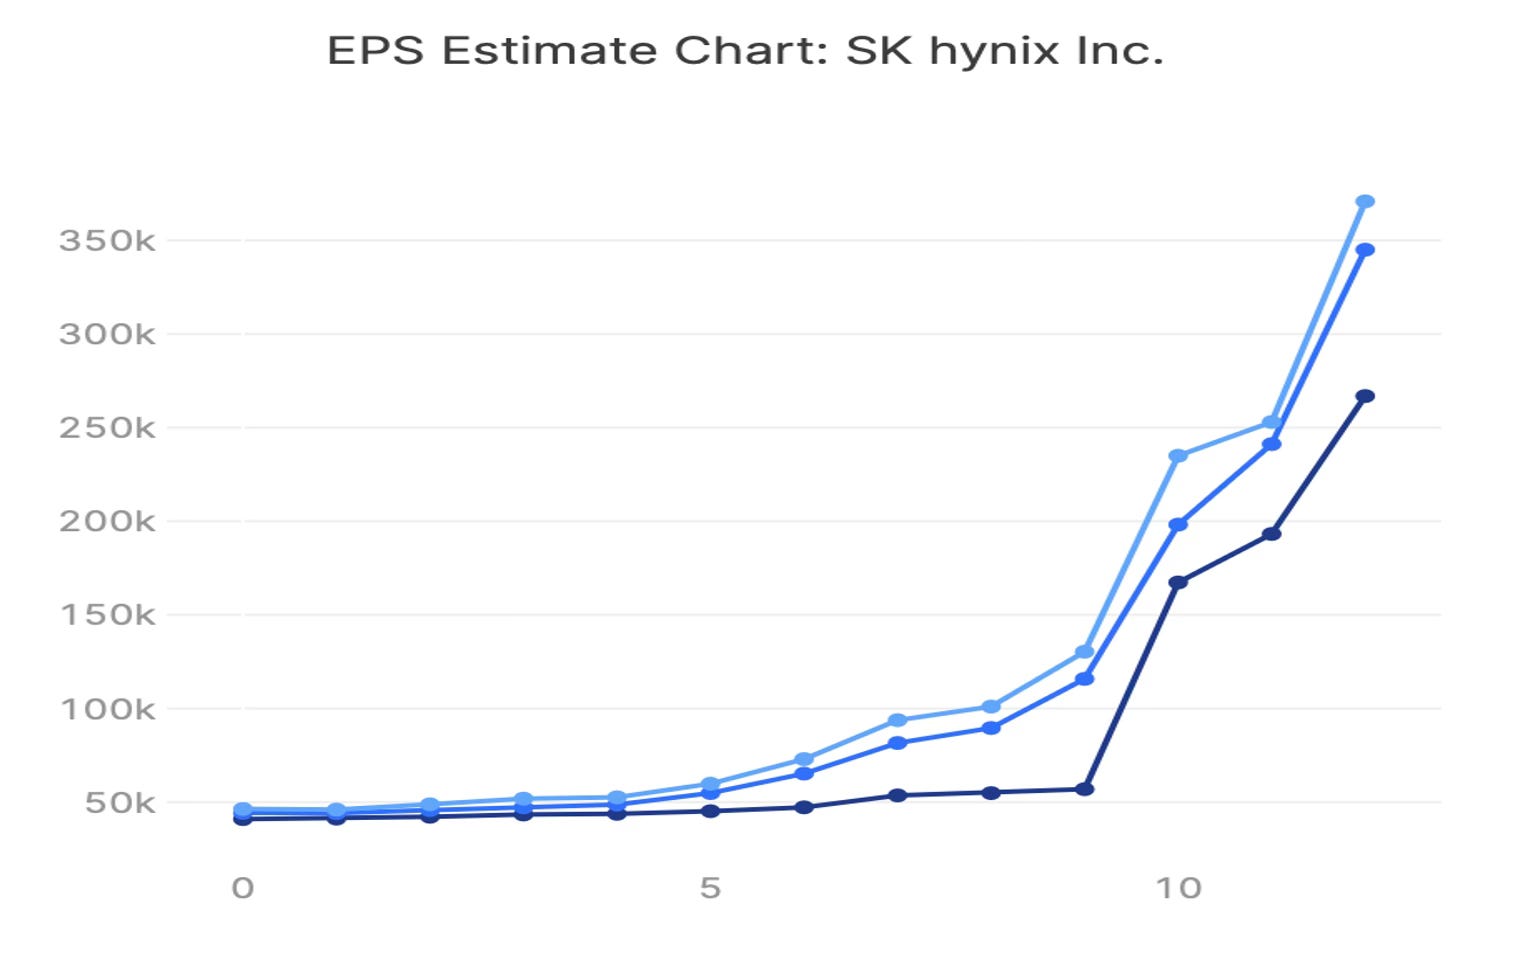
Memory: SK Hynix EPS estimates are going insane. The 2026 EPS estimate has jumped from KRW 160,000 to 260,000. Just to give you some perspective in October 2025 I thought I was edgy in predicting SK Hynix could earn KRW 50,000/share when consensus was 40,000. Instead the number is approaching KRW 300,000.
Despite being the market leader in the biggest AI bottleneck, SK Hynix is still trading on a P/E of 4.5x. Samsung is the same. Samsung’s 2026 EPS estimate has jumped from KRW 23,000 to 34,000. Samsung with a $1 trillion market cap and a more diversified business is trading on a P/E of 6x!! You get all the optionality of if Samsung can ever be ‘the next TSMC’ foundry for free.
Taiwan Tech: the Taiwanese semiconductor supply chain still has some of the best estimate revision trends in the world. It’s Nanya, Macronix, Winnbond, Innodisk, Elite Semiconductor, and Phison.
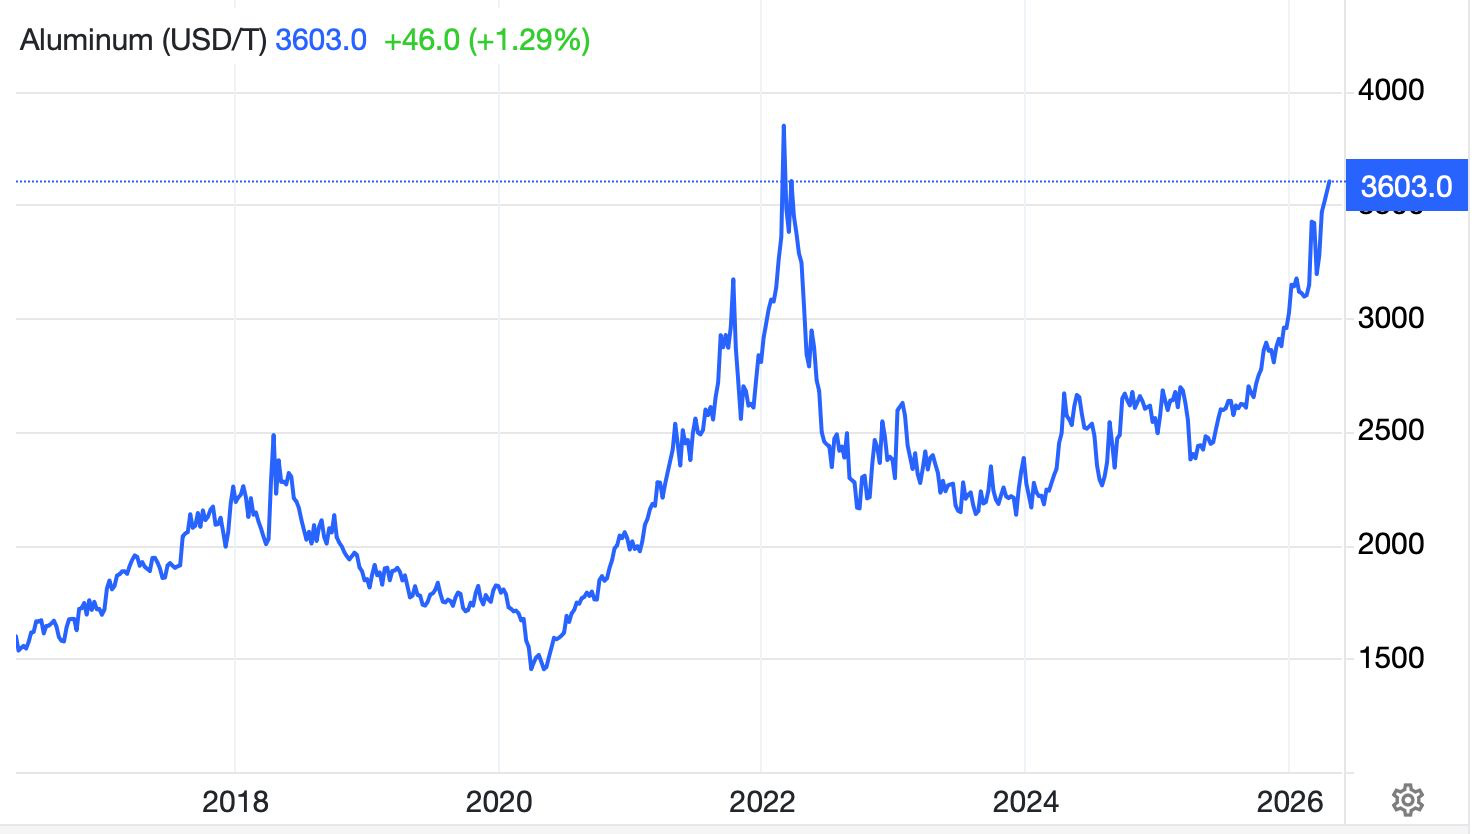
Gold and Other Metals: Surprisingly there is only one gold miner in the Top 30. Aura Minerals is a gold-copper producer. Nexa Resources is Zinc. Century Aluminum is also in the top 30 on the back of the rise in aluminium prices.
Potential 2nd derivative play: Aluminum prices rising might also be good for steel. On Monday last week Stevie sent me an interesting snippet from the Cleveland Cliffs conference call about automakers switching from aluminium to steel.
“In my long career in this business, I have never seen so much momentum and substituting aluminum with steel... Automotive OEMs are prioritizing supply certainty, total cost and safety.”
Does US HRC steel roof it next?
Oil and Gas: Finally, the monster trend. The YWR Top 30 is flooded with oil and gas companies. This is the dominant new trend taking over everything. The estimate trends are strong, the price momentum is high and the valuations are still low, because nobody trusts the move. Nobody wants to be the idiot who buys oil and gas stocks the day before the Iran War is resolved.
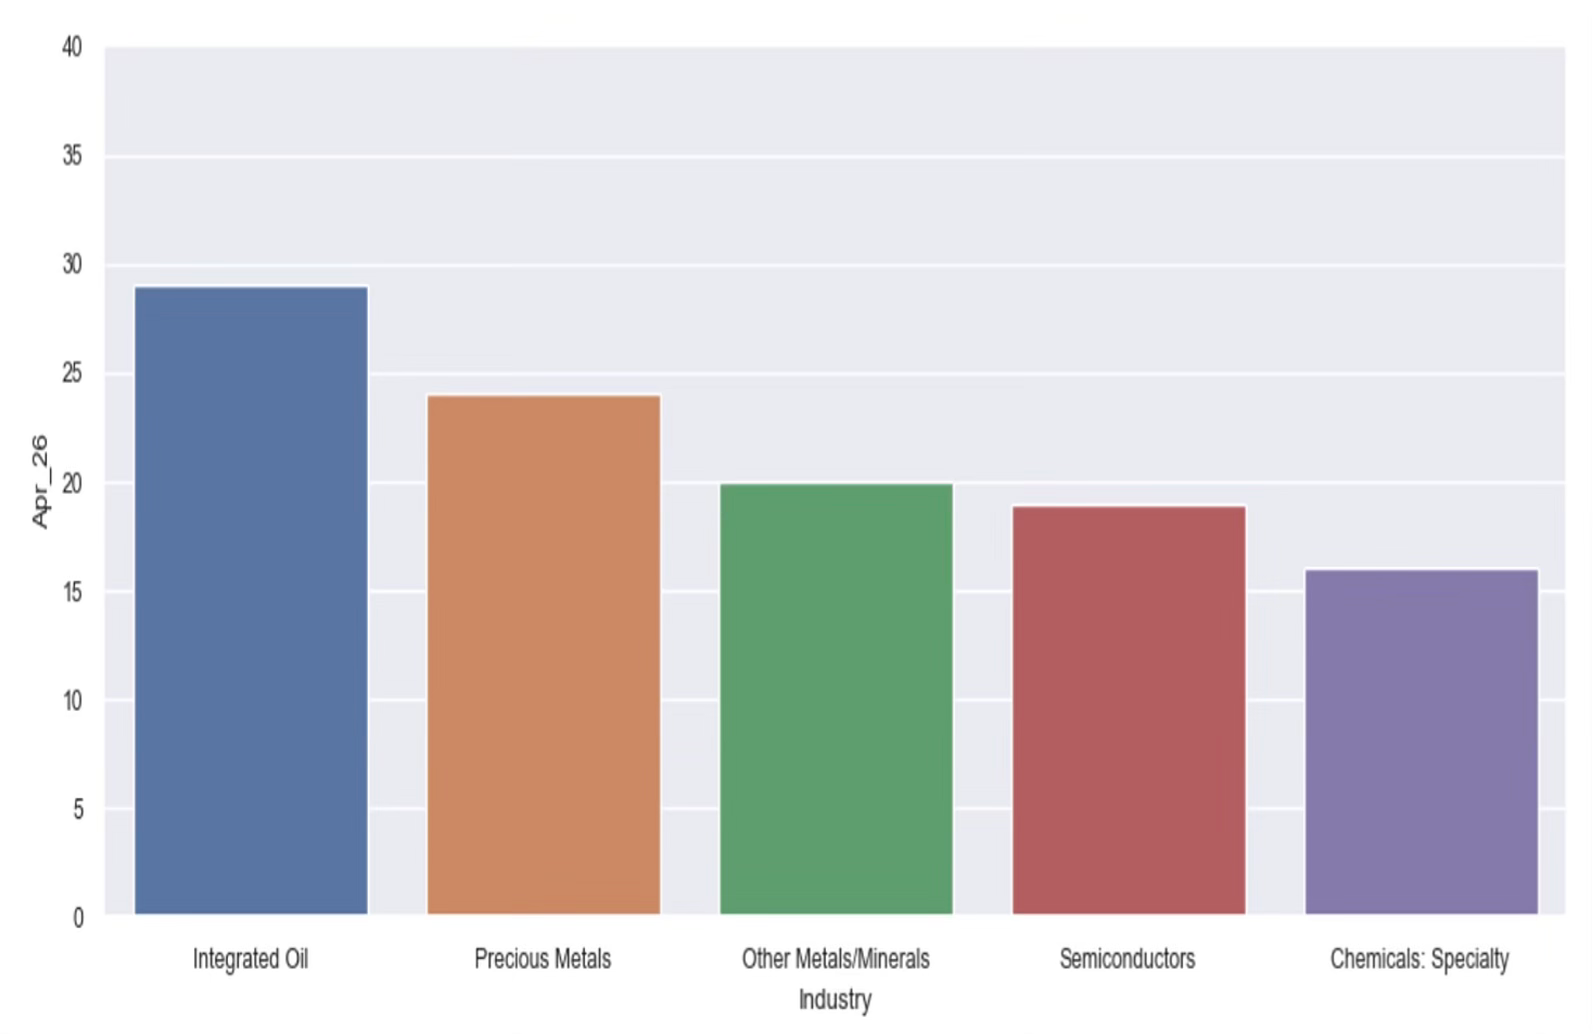
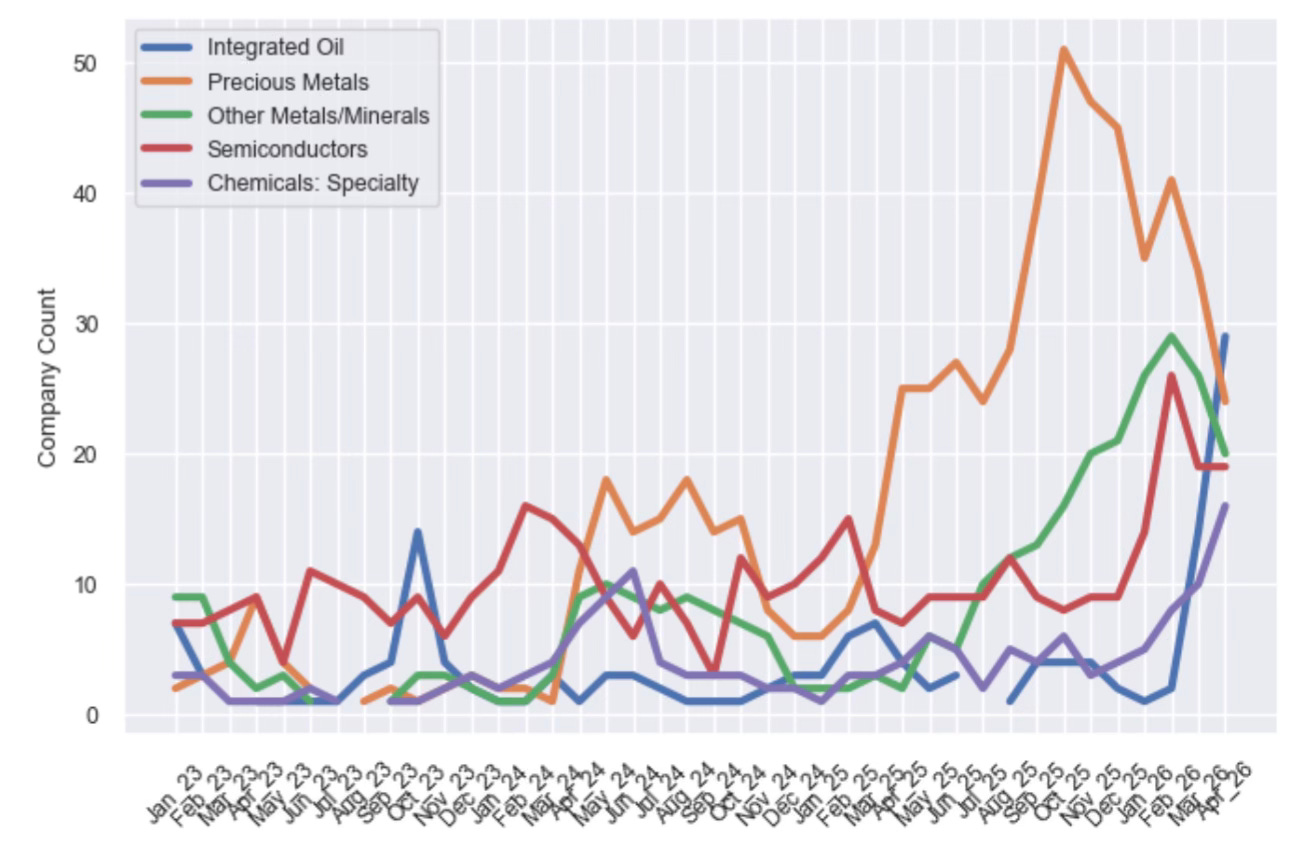
Top 5 Ranked Industries
Integrated Oil is the top ranked industry in the world this month. It has displaced gold, which falls to #2. Then we have Other Metals, and Semiconductors.
Number 5 is interesting. It’s Chemicals. Chemicals prices are also benefitting from the disruption in the Middle East. Stevie surfaced this snippet from the DOW call.
“Roughly 20% of global oil capacity is currently offline and approximately half of global ethylene and polyethylene supply is either offline, constrained, or directly impacted... The longer these conditions persist, the greater the potential for further industry changes. And lastly, it is not likely that the pricing impact of these events will be temporary.”
In the monthly trends chart below we see the sharp acceleration in Integrated Oil and Chemicals. We also see the falling momentum for precious metals.
Three other observations:
#1 Refiners: Estimate revisions for refiners are going through the roof as well. The valuations are also attractive because everyone doubts if the earnings are ‘sustainable’.
#2 Banks look good too: Banks don’t make the top 5, but the estimate trends there are positive too. It’s a positive backdrop for our Global Boom trend. Also, if interest rates are not going to fall, and we have higher for longer, it’s positive for net interest margins. First Hawaiian mentioned this.
“With the markets now expecting no rate cuts this year, we have revised our full-year NIM outlook to be in the 3.22% to 3.23% range.”


#3 Do we have an inflation spike coming? If the top ranked industries globally for estimate changes are energy, metals and chemicals… do we have an inflation spike coming?
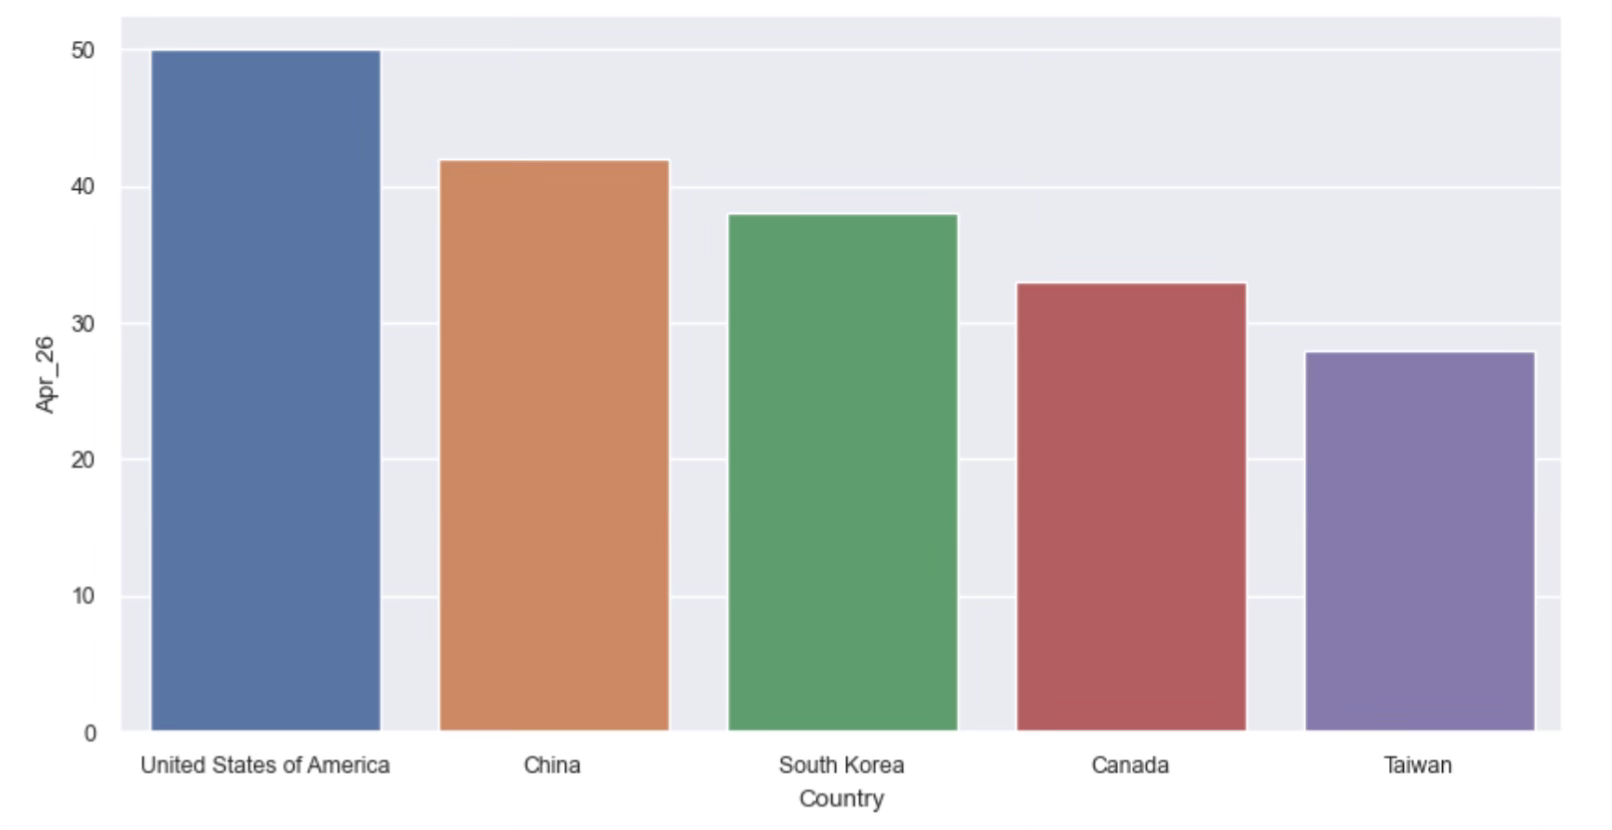
Top 5 Ranked Countries
The Top 5 countries are the same suspects. The US always has the most top ranked stocks, which is a reflection of both strong growth and the higher number of stocks across all industries. Then comes China, the biggest market nobody ever owns, at #2. Then South Korea and Taiwan because of the semiconductor/memory boom. Canada (and Australia) rank well because of their commodity stocks.
But what do we almost never see? Aside from the UK every now and then, the European markets struggle to rank well. Which is why I keep thinking Asia is the New Europe. Do we need to shift our focus from US + Europe to US + Asia Pac? I’m trying to travel to Asia more.
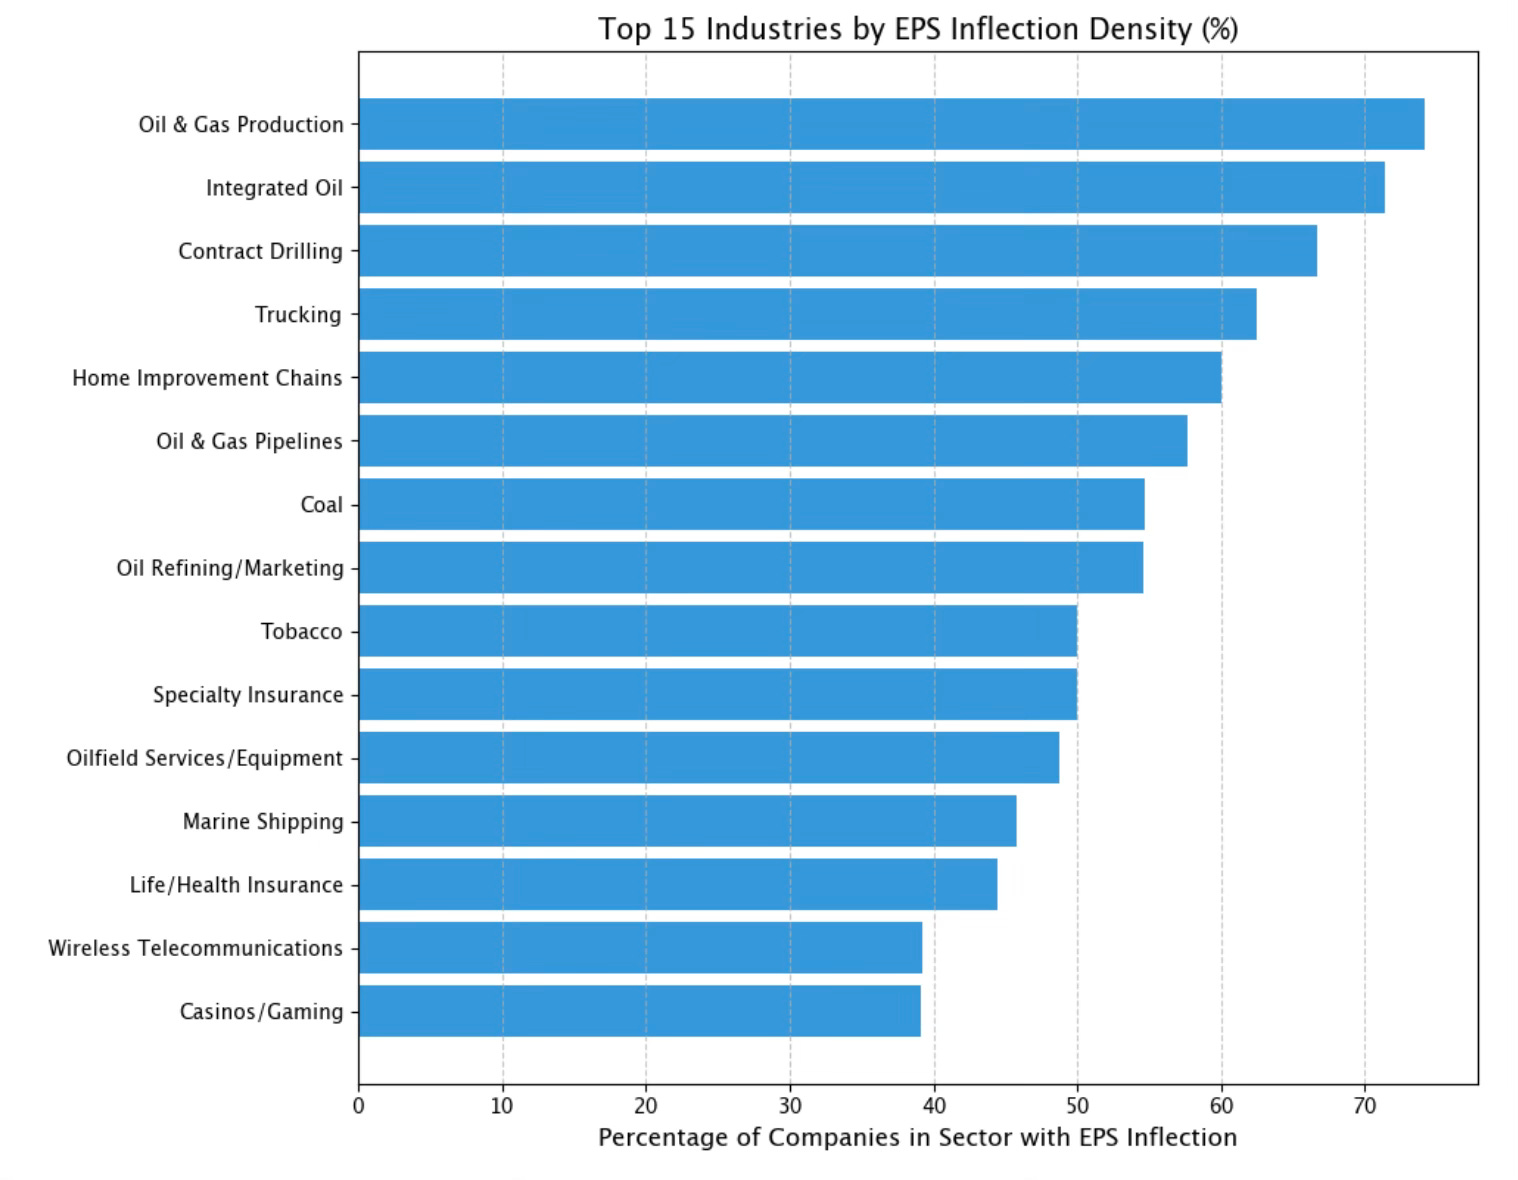
Inflection Analysis
This is an exercise where we identify downtrends in estimate revisions which have flip positively in the last 6 months.
Everything to do with energy has inflected sharply this year. We noticed this early on in December (Global Inflections), but the trend has gone supersonic.
I’ve included below two Google Sheets with the top inflection stocks by country and industry.
Oil Services: Stevie pulled this snippet from the Haliburton call on how the pick up in oil services will not be temporary.
“The cumulative production deficits are in the several hundreds of millions of barrels and trending towards a billion. This represents several years of meaningful incremental demand to replace strategic reserves on top of what I believe will be continued structural demand growth. Big picture, this means the world is fundamentally tighter in oil and gas than it was sixty days ago.”
The Million Dollar Question
Having reviewed all the data together. Having reviewed the trends across energy, chemicals, oil services, refining, shipping and bank net interest margins, we come to the million dollar question.
Are we in a prolonged period of energy scarcity?
Go back and reread the Halliburton quote.
The energy disruptions in the Middle East have coincided with a global investment boom (‘structural demand growth’).
Does it mean energy prices stay higher for longer? ($200 oil pops the bubble).
Could the energy theme be bigger than AI/Semiconductors and Memory?
What does this mean for global interest rates?
What does this mean for geographical allocation?
John Burbank’s quote is in my head.
“Investors always underestimate the magnitude and persistence of trends.”
Answer to the Million Dollar Question: My sense is energy prices are going to be a problem for a long time and we are going to have to live with it. And we all need to bite the bullet and be bigger in energy related stocks (personal view). In Qatar Changes Everything I gave my view that the US LNG terminals are good long-term beneficiaries without the risk of getting whipsawed on commodity prices. But maybe you need to own the integrated players like Total and Shell which are still trading at < 10x earnings.
Below are links to all your data tools; the Tableau dashboard to review industry estimate trends, the Retool data dashboard with the estimate trend charts (I love this tool), the Google rankings sheet, and the inflection sheets.
