
YWR: Global Factor Model

Are you ready for the new, new? Me too.
It’s why we review the global factor model data at the end of every month.
We analyse estimate data, valuations and price momentum on over 4,000 global stocks to identify the top themes already working, and find new themes just starting, which nobody is talking about.
But first, new, new #1. And it’s a biggie.
I did something bad.
Something my business manager said was terrible, but which had to be done anyways. It’s just too cool.
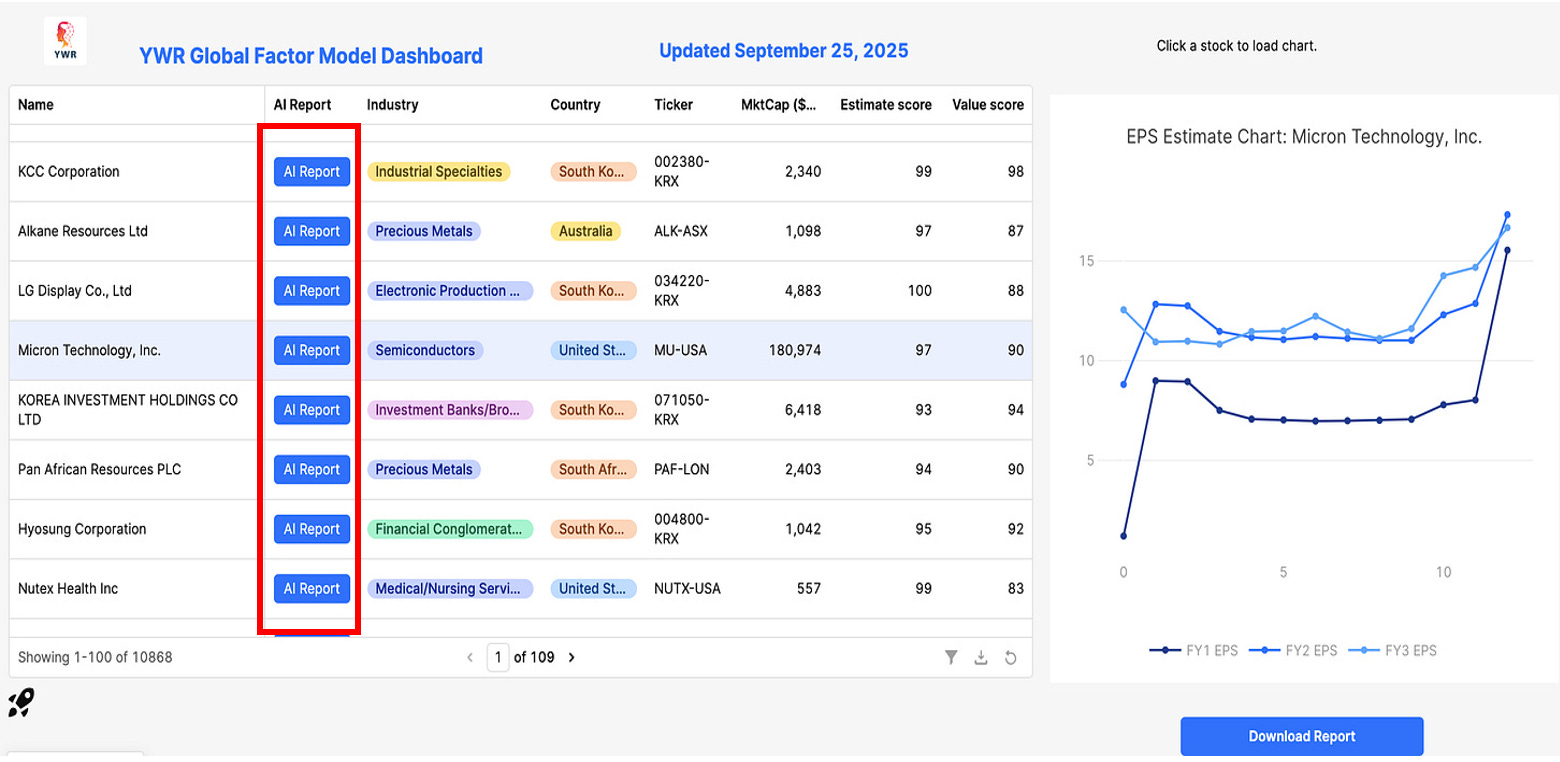
I integrated the YWR Intelligence AI Reports into the Global Factor Model Dashboard App.
Now, as you are scrolling through the dashboard, filtering, sorting, looking at the stock rankings, checking out estimate revisions and you find something interesting, a stock you don’t know, you just click the ‘AI Report’ button.
Pressing the ‘AI Report’ button ignites a 5,000 line code file which sends out AI analysts to crank through the business model, news headlines, transcripts, financial data, bull case, and bear case on the stock you are interested in and serves you up a 6 page investment summary report.
It’s a lot of work for your AI agents, and takes 2-3 minutes to run so maybe get yourself a quick coffee while they scurry about.
The YWR AI Report covers tremendous ground and tells you right away if you want to dig deeper. If you want to know more background on the YWR AI report watch our Building AI investment reports tech talk.
The link to the new YWR Factor Model Dashboard with AI is at the bottom of the post!
Now on to the rankings.
Quick technical disclaimer. I was trying to get more Indian stocks into the universe, so I opened up the market cap limitations to over $500mn and reduced the average daily liquidity requirement to $1 million. As a result there are a lot more small caps in the results. Let’s see if it’s annoying or we like it. BTW, the Indian stocks don’t rank very well. Too expensive.
Global Top 30
The top 30 is such a tiny sliver of the universe of over 4,000 stocks, but it’s still interesting to see what makes this elite list.
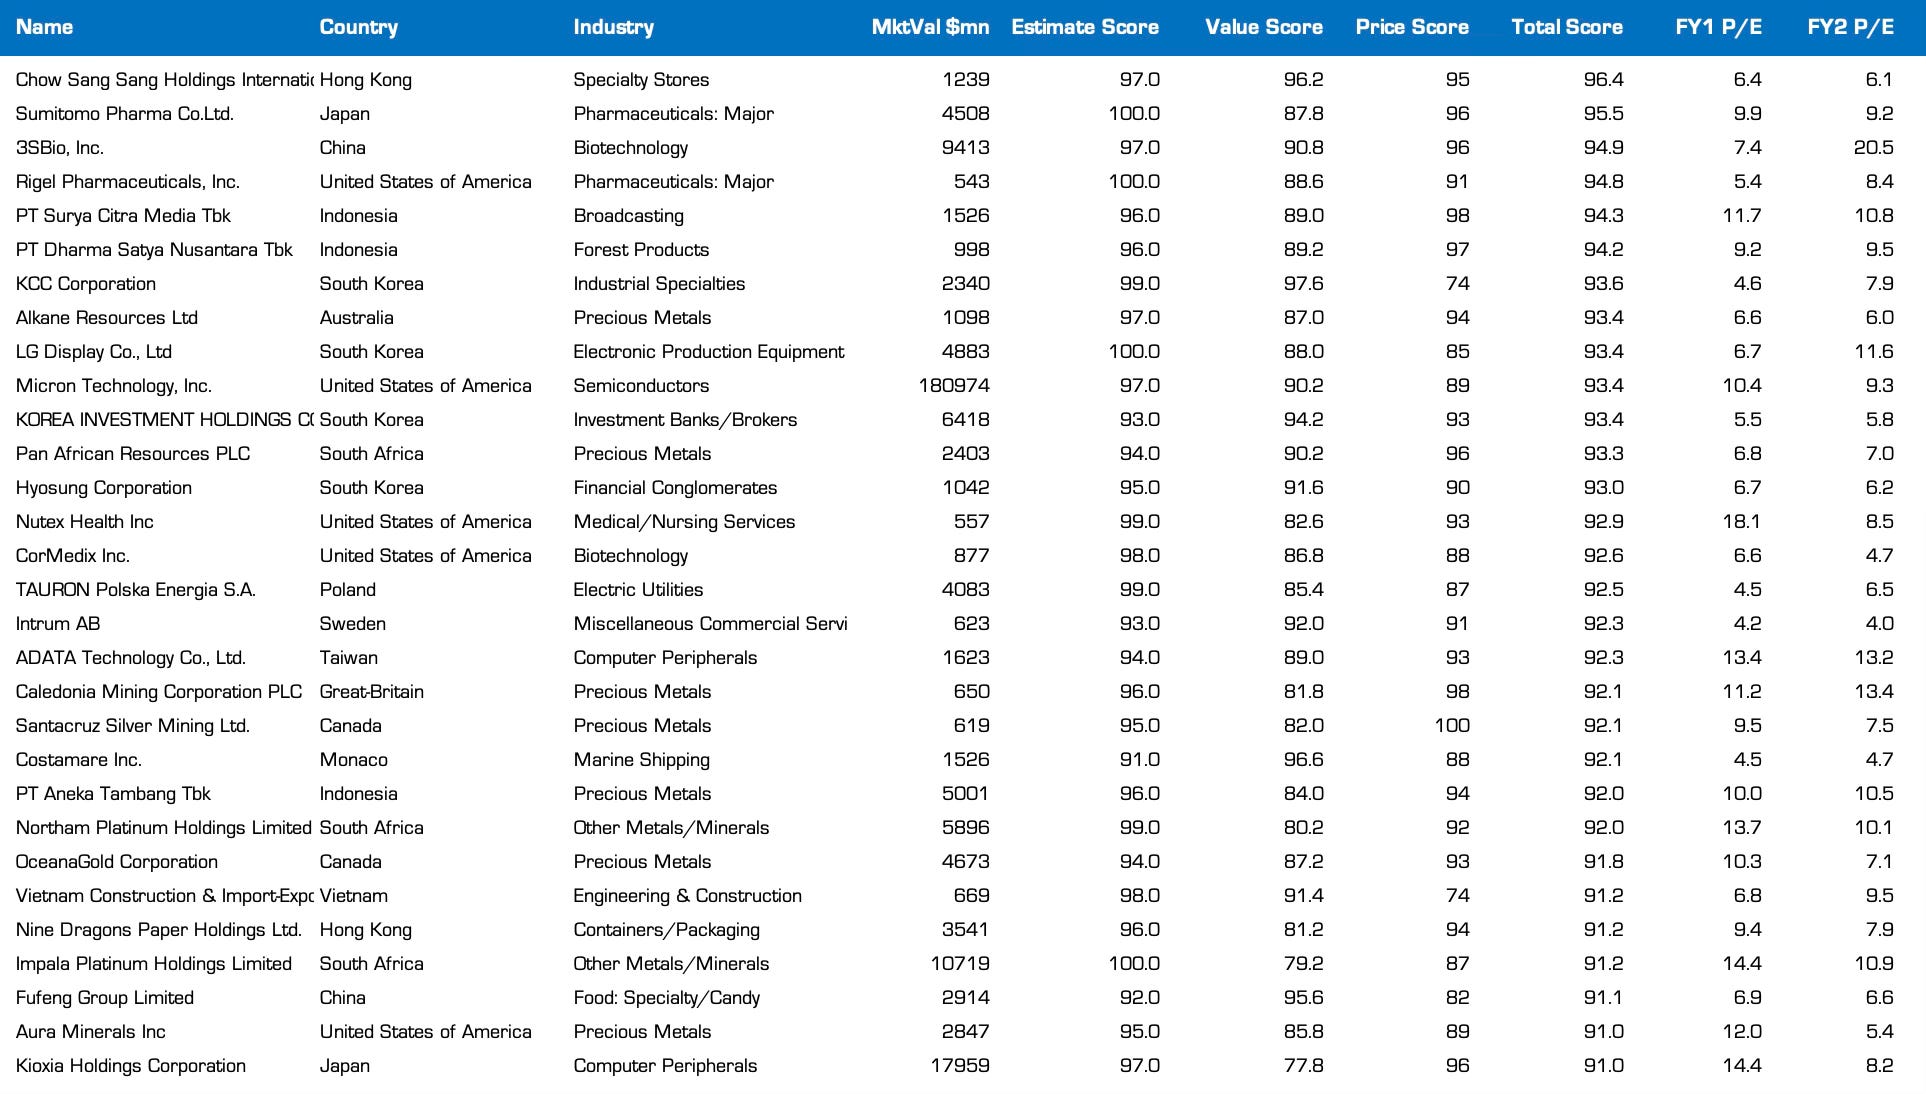
The biggest trend we see is gold mining (precious metals) and gold related stocks like Chow Sang Sang (jewellery). We see also that the gold mining momentum has spread to platinum/palladium miners like Northam Platinum and Impala. Interesting. On a macro level both gold and platinum mining doing well is super positive for South Africa.
A second big trend is Memory. We’ve talked about SK Hynix (Nvidia on 7x), but the memory momentum is spreading. In the Top 30 we have 3 memory plays (ADATA, Micron and Kioxia). Further down the rankings Western Digital and Sandisk also rank well with huge upgrades.
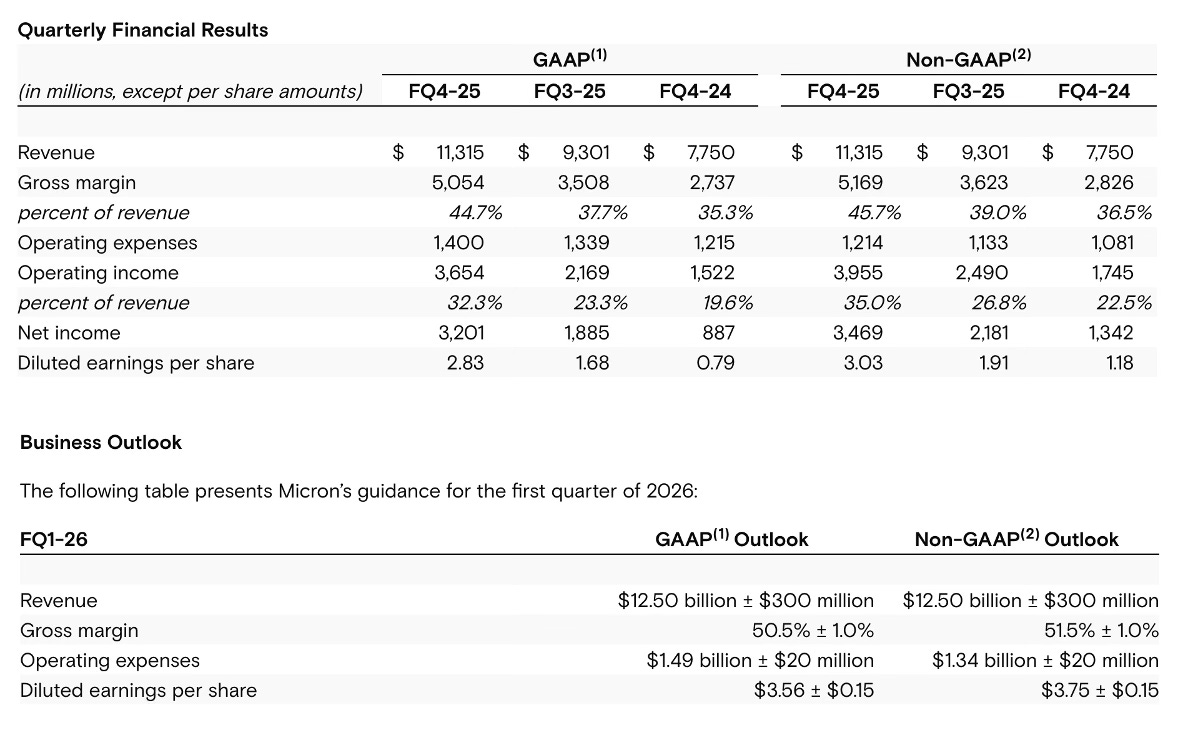
Micron had great results and the guidance was huge. They made $2.83 in the Q4 ending in September and guided to $3.56 in Q1. These are Nvidia style jumps in earnings.
Gold miners, platinum, and memory, we love them, and they will go higher, but they’ve all had good moves.
Where’s the fresh meat?
What’s something where the earnings are perking up and the stocks haven’t move yet?
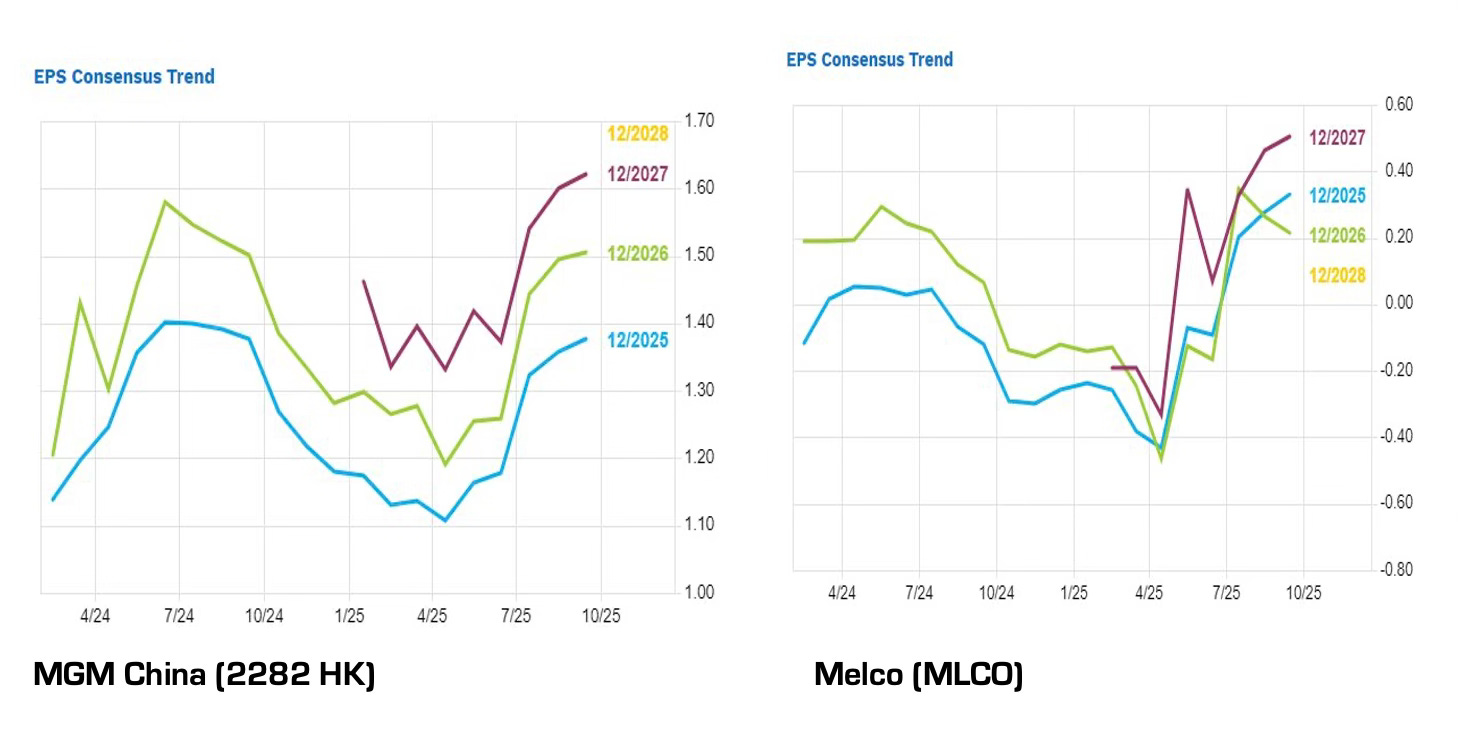
I have 2 ideas. The first is Macau Gaming.
I’ve been bullish on Macau gaming for a long time and it’s been a dud. But maybe its time has come. The meta view has been that China is recovering and we are going to have a huge market rally, which nobody is positioned for. It’s why last year we were buying HKEX, SGX, China tech stocks, etc. The 2nd derivative, and why we bought LVS, was that this surge in China/HK liquidity was going to spill over into Macau casinos, which have huge operating leverage to higher gambling activity.
Now with the Hang Seng +33% YTD, and people finally starting to get positive on Chinese stocks, surprise, surprise, we also start to see increases in estimate revisions for MGM China and Melco. And the stocks haven't really moved.
Now let’s look at the industry level rankings and idea #2.
Industry Rankings
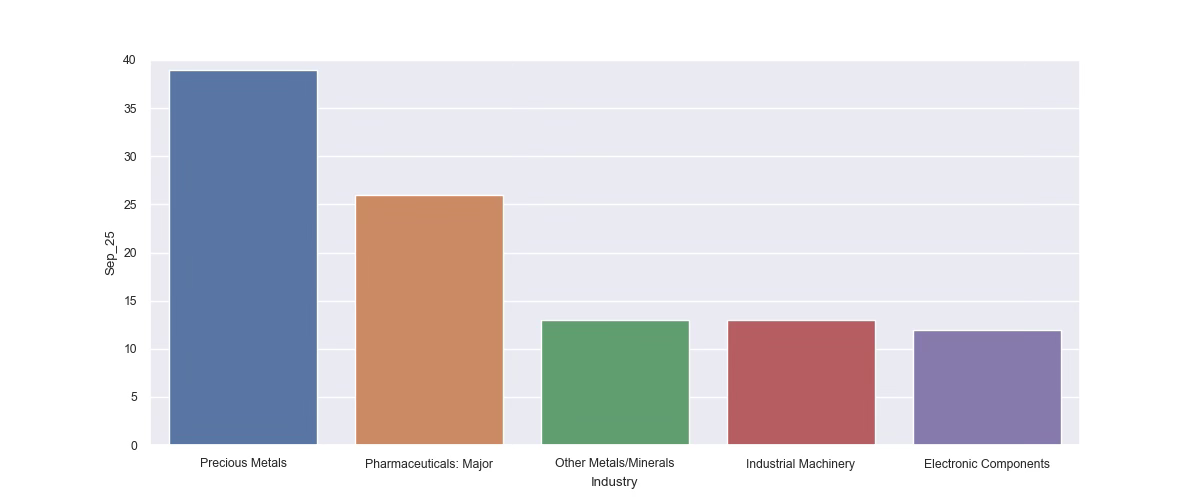
When we look at the best ranked industries in the wold Precious Metals dominates everything. We’ve talked about the mysterious momentum in Pharma which we think is linked to changes in Medicare Advantage drug benefits. Then we see other Metals/Minerals which is a mix of platinum miners, copper miners and uranium stocks.
Can we just stop and notice here that 2 of the top 5 ranked sectors in the world are mining sectors… and nobody owns them… except the retail traders. No wonder they are posting screenshots of their P&L’s on Twitter while the traditional fund managers are grumpy.
One other side note. Banks always used to be a top 5 sector, but has dropped of the list.
When we look at the monthly trend we see the rise in gold miners and pharmaceuticals. However, also notice the rise in industrial machinery.
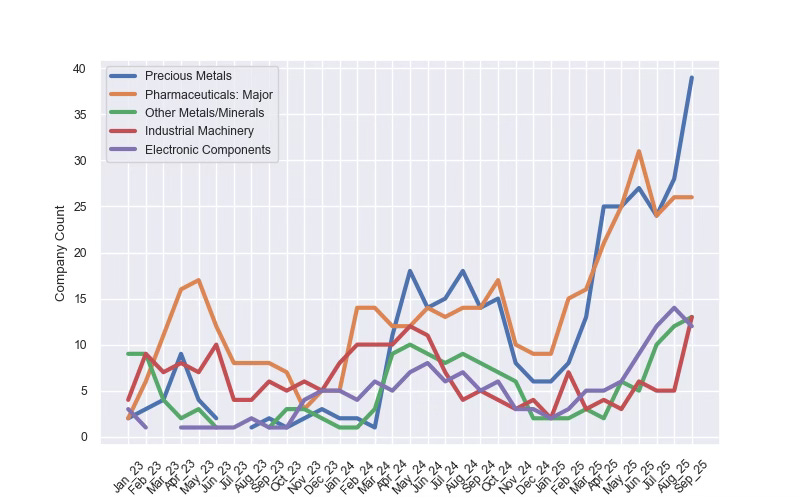
If you go to the rankings sheet (link at the bottom of the post) and filter for the Industrial Machinery you will see it is tons of Chinese, Taiwanese and Japanese companies, most of which you won’t know like Guangdong Lyric Robot Automation or Hangzhou Zhongtai Cryogenic Technology Corp, or Leader Harmonious Drive Systems Co… but then some you do, like Lam Research and FUJI.
Can I make a macro point.. China is probably not crashing when all these super high tech machinery companies are ranking amongst the best stocks in the world for estimate momentum.
And you know how we play it without having to learn Chinese or go to Shenzhen to figure it out? HKEX.
Now for ‘hasn’t move yet’ idea #2.
Every month I create a Tableau visualisation of the rankings (link at the bottom) where I sort sectors by estimate momentum only, vs the combined ranking scores which include valuation and price momentum. Sometimes we just want to see estimate momentum by itself.
And when we do that we see some interesting things.
What are the top sectors in for estimate revisions? Precious Metals. Of course. Then ‘Investment Banks and Brokers’ which is a slew of Chinese and Korean stock brokers, which are booming. But below that is Agricultural chemicals… how interesting. And when we click into the data we see super high estimate scores for all the fertiliser stocks.
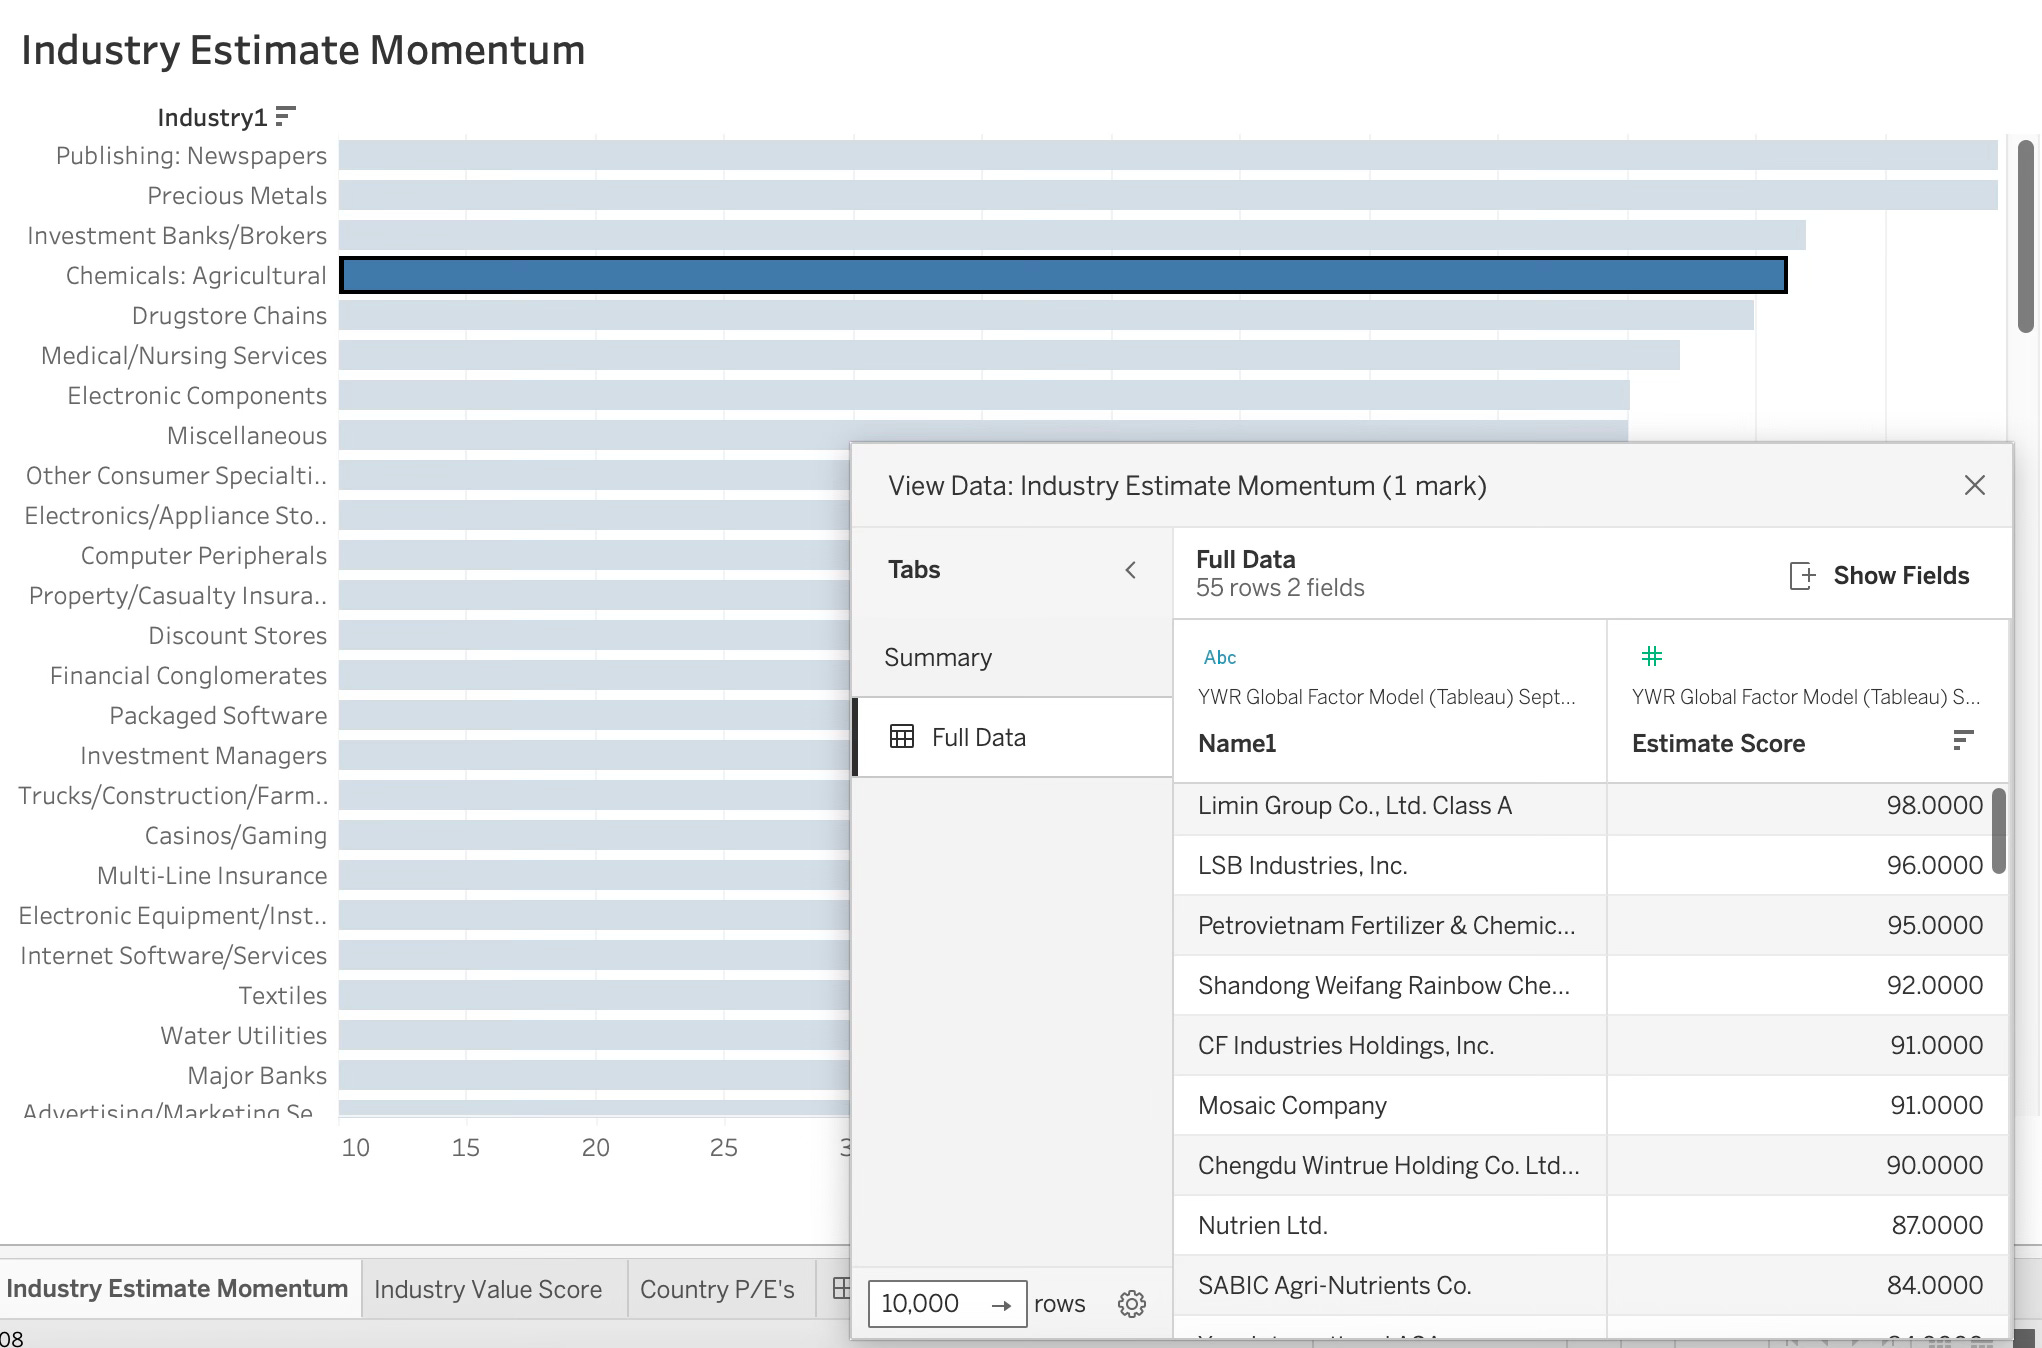
When we pull the estimate revision charts for Mosaic and Nutrien they look pretty good. Nice trending upgrades. And what’s better the stocks haven’t really moved.
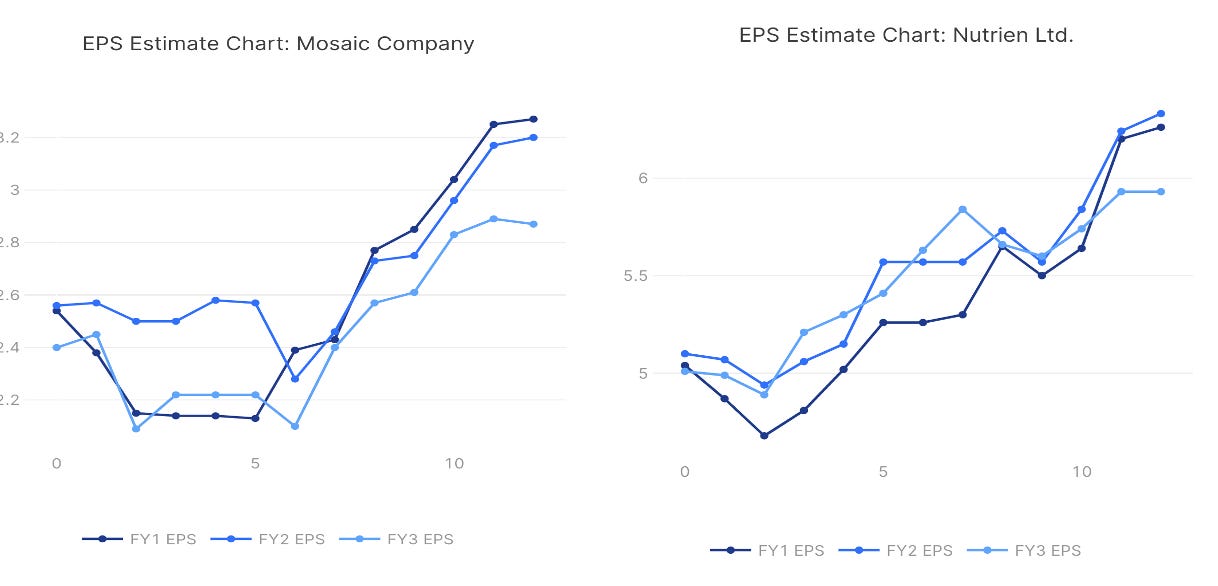
And of course the next step in our process is to click the ‘AI Report’ button, which will amongst everything else, give us the trends and highlights from the last 3 transcripts. Whereupon, our AI analyst serves up this tasty gem of a quote from the Mosaic call.
”Put simply, there is not enough phosphate fertilizer available to meet demand, and we expect this dynamic to continue well into 2026.”
Boom!
I might have to take back all the nasty things I said about Fertiglobe.
And can I make another macro observation here? What are we noticing? The estimate momentum started last year with gold mining. It then spread to copper and platinum. Now it’s spreading to fertilisers. Probably next will be be energy. The commodity bull market that nobody owns looks like it’s happening.
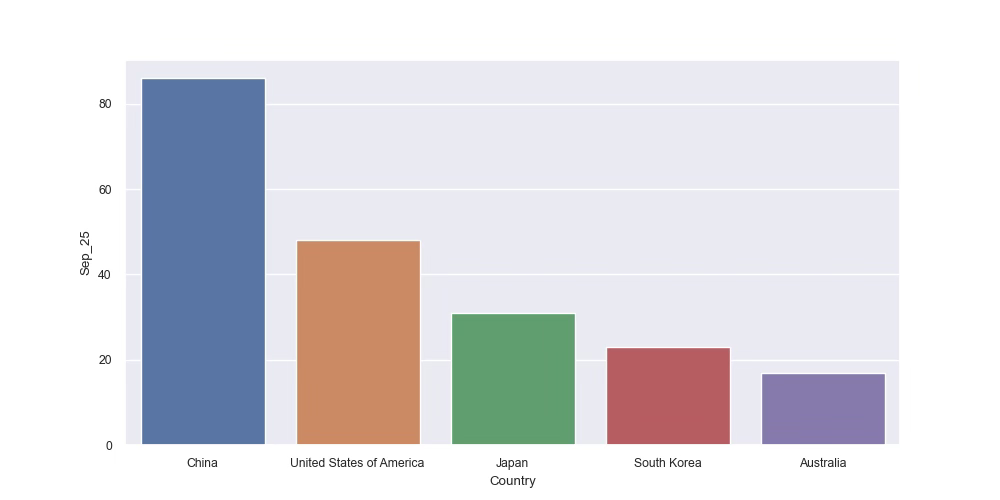
Country Rankings
As you can guess China leads the world in the rankings. Nothing can compare with its mix of earnings momentum, low valuations and price momentum. Other Asian countries like Japan, Korea and Taiwan also rank well because of the surge in hardware across semiconductors and now robots. Then Australia, Canada and increasingly South Africa rank well because of mining.
The monthly trends shows the real drop off in US momentum. The action is increasingly elsewhere.
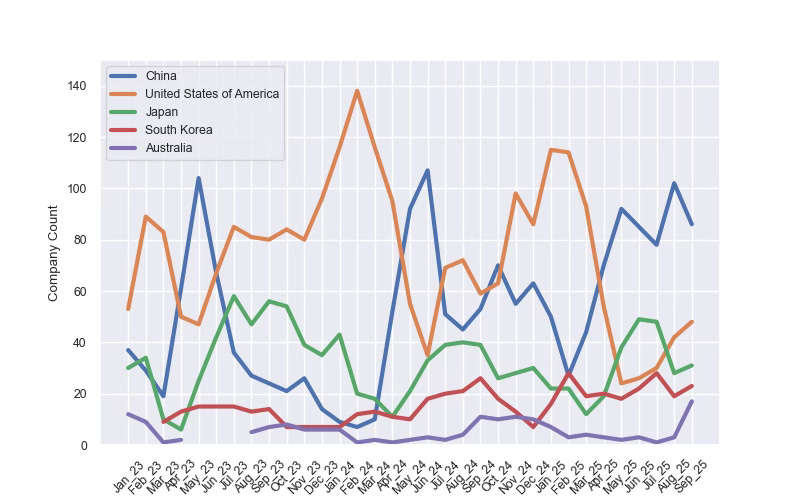
Another thought on the country level rankings. When I go through these thousands of names each month… I’m surprised how many are machinery, pharma, biotech, and tech hardware names in Asia, which I don’t know. Is this the future? Then if so we need to relocate to Asia and get more into the weeds. The new asset management research offices should probably be in Taipei, Shenzhen, Seoul or Tokyo.
Those are my thoughts. But as always the tools are there for you to do your own analysis. Which you should do.
Below are links to:
the new Factor Model Dashboard with AI
the Google Sheet with the full YWR Factor Model Rankings so you have all the data in Excel too.
the Tableau visualisation so you can look at sector level estimate momentum plus the price/estimate scatter chart.
