YWR: Killer Charts
Disclosure: These are personal views only and not investment recommendations. For financial advice seek professional help.
Time for Killer Charts. It’s where we review charts on positioning, sentiment and valuations.
The problem is I had so many good charts they wouldn’t fit into one post.
So I made myself a coffee, put on some tunes and built you an 80 slide chart pack. This way you have everything.
The chart pack includes charts from:
JP Morgan Guide to the Markets
BofA Fund Manager Survey for March
Goldman Sachs
S&P 500 estimate data from FactSet
Real Estate data from Fannie Mae and John Burns Consulting
I’ve put a link to the full 80 slide presentation at the bottom of the post.
Here are 12 charts I’d like to highlight and the reasons why.
#1. Fed Funds Expectations
This is one of the scariest charts in the market. Scary, because it’s wrong. We are not going to have 3 rate cuts to 4.5% by year end. The Fed and the market are starting to realise this.
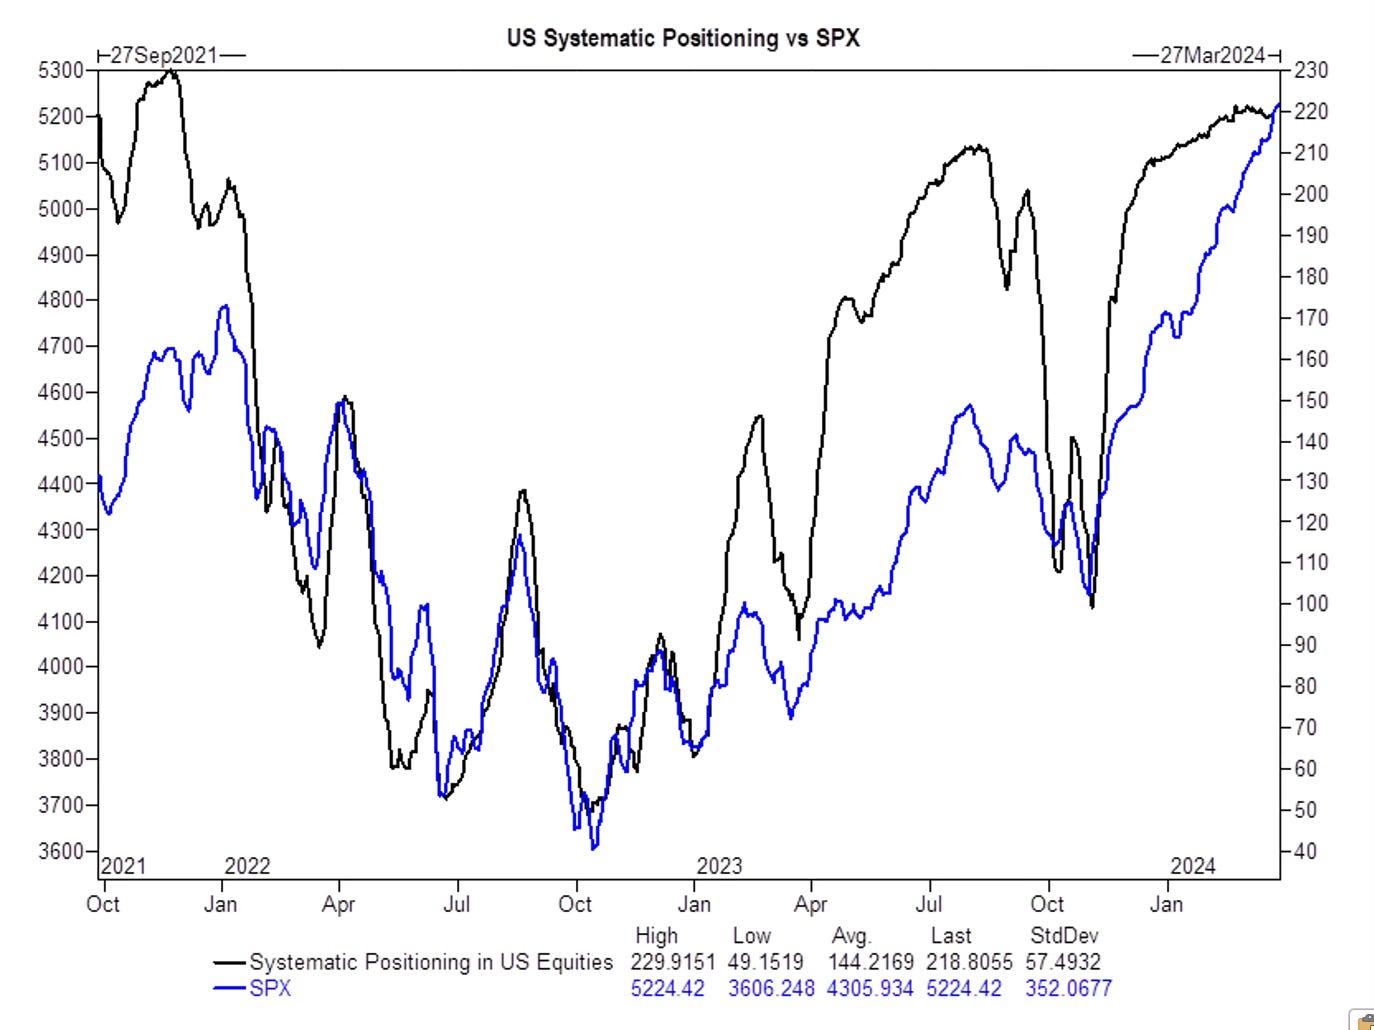
#2. Systematic Fund Positioning
The S&P 500’s gradual, low-vol, multi-month climb has sucked in the CTA’s and Volatility Control funds. Everyone has been lured back into the pool. Their sophisticated models are telling them to go maximum long. Volatility is low. What could go wrong?
All of these strategies operate the same way. They cut risk quickly when volatility rises, then mechanically add it back gradually. It’s a sell low, buy high approach.
From here the balance of probabilities is that their next move will be a sudden de-risking.
#3. Hedges Fund are Max Long again.
Hedge funds are a huge contrarian indicator. They also cut risk at the bottom and add it at the top. It’s unfortunate that they are maximum long again and another indicator the S&P 500 is due for a wash out.
#4. Stock Buybacks Keep Rising
This is actually 2 charts which I stuck together to make a point. Over the last 20 years the only net buyer of stocks in the market has been the companies themselves. Retail investors own a lot of stocks, but aren’t adding new money. Neither are the mutual funds and pensions funds.
The only guys in there buying $1 trillion worth of shares everyday are the companies. Which makes you consider maybe it doesn’t matter what you, I, or the strategists think about the market and its valuations. We aren’t the ones buying shares so who cares what we think.
On the other hand companies like buying back shares and continue to do so in greater amounts every year.
I would imagine if you are an investment bank you would tell your sales desk to stop calling funds, and to call companies instead. They are the real clients.
This market structure suggests we can have abrupt, short-term sell-offs while CTA’s and Hedge Funds are derisk, but after a few weeks those flows are done and we revert to the steady pull upwards of buybacks. Like gravity.
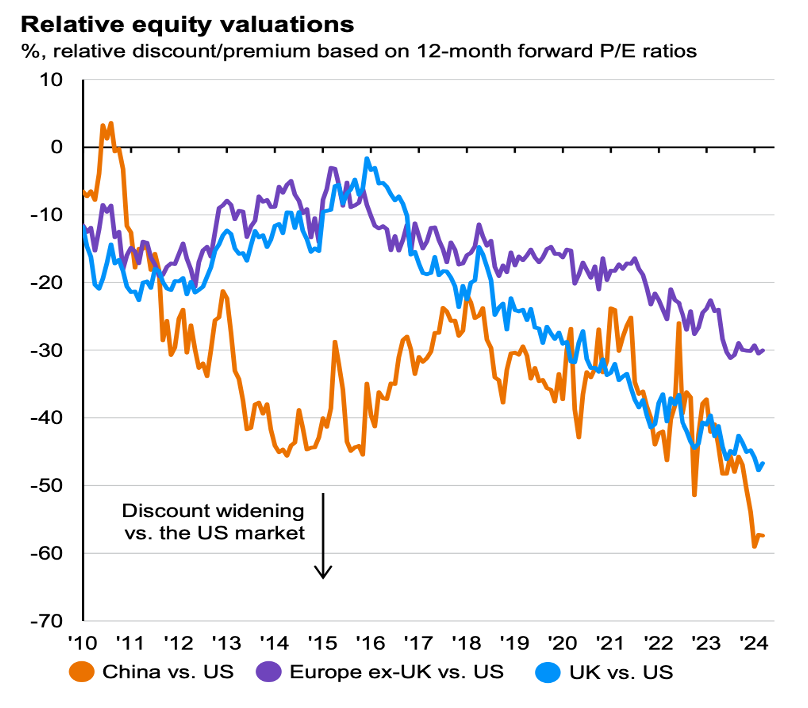
#5. The UK is a Dripping Roast
Investors continue to be underweight the UK despite the fact it has the best valuations with dividends and buybacks (6%). I like to call the UK, ‘the China of Europe’, because people hate it so much.
Investors always have a negative view on the UK (Brexit, housing market, etc), but don’t realise the big-cap stocks actually have very little to do with the ‘UK’. Many of the large UK stocks are multi-nationals listed in the UK (BP, GSK, AstraZeneca, Unilever, HSBC, Shell, BAE Systems, Diageo, etc)
Dirty Dividends owns Barclays, BP, Glencore and BAT (Dirty Dividends Update).
#6: The Chinese consumer is stacking it up!
So much negativity on China and yet so little understanding of the actual situation in the economy. Yes, Chinese consumer sentiment is terrible, but their balance sheet is fine. They are paying down debt and saving more. When their animal spirits return Chinese households are sitting on CNY 20 trillion (US 2.7 trillion) in bank deposits.
China is YWR’s Surprise Market for 2024.
#7. S&P 500 Earnings Estimates are stable but Q3 24 is key!
S&P 500 earnings estimate are stable and imply 10% EPS growth in 2024 and 13% in 2025.
But on a trailing basis the EPS trend has been quite flat.
Prices have run ahead of the anticipated 2024 and 2025 EPS growth, so that quarterly uptrend starting in Q3 2024 is key.
#8. The Housing Market is perking up again.
Homebuilder stocks have gone through the roof, but the rest of the housing market is also starting to pick up. Existing home sales rose in February and house prices are rising too.
This is particularly bad news for the Fed. It ends up being another reason to not cut rates in 2024. The Fed can ignore an overly inflated stock market, but they know they would be pouring gas on a fire if they cut rates while an already inflated, expensive housing market is rising again too.
Full Killer Charts Presentation
Like I said, there were more charts than Substack can handle.
If you want to get into the BofA Fund Manager survey more, or any of the other charts, I’ve put in a link below to the full presentation.
Have a good weekend. Spring is here!
Erik


