YWR: Killer Charts
Time for the top charts of the month.
The full 53 slide deck is available at the end of the post.
JPM mid-year Asset Allocation charts
BofA June Fund Manager Survey
S&P Investment Manager Index
FactSet S&P 500 Earnings Revisions Data (June)
Assorted Market Charts (Goldman and others)
Auto Sales YTD (US, Europe, China)
Europe Summer Sale
This sell-off in European banks is another good entry point into a multi-year uptrend.
Same thing with France.
Does it really matter to the top companies in France whether Macron or Marie Le Pen’s party is elected. No.
It’s a massive storm in a tea cup. I need to buy a little more Vinci (DG FP).
JP Morgan’s Mid-Year Review.
JPM has reviewed everything and agrees Europe looks too cheap given the positive economic surprises.
One of our YWR themes is that European banks are piled high with capital and it could catch everyone by surprise if they start to lend.
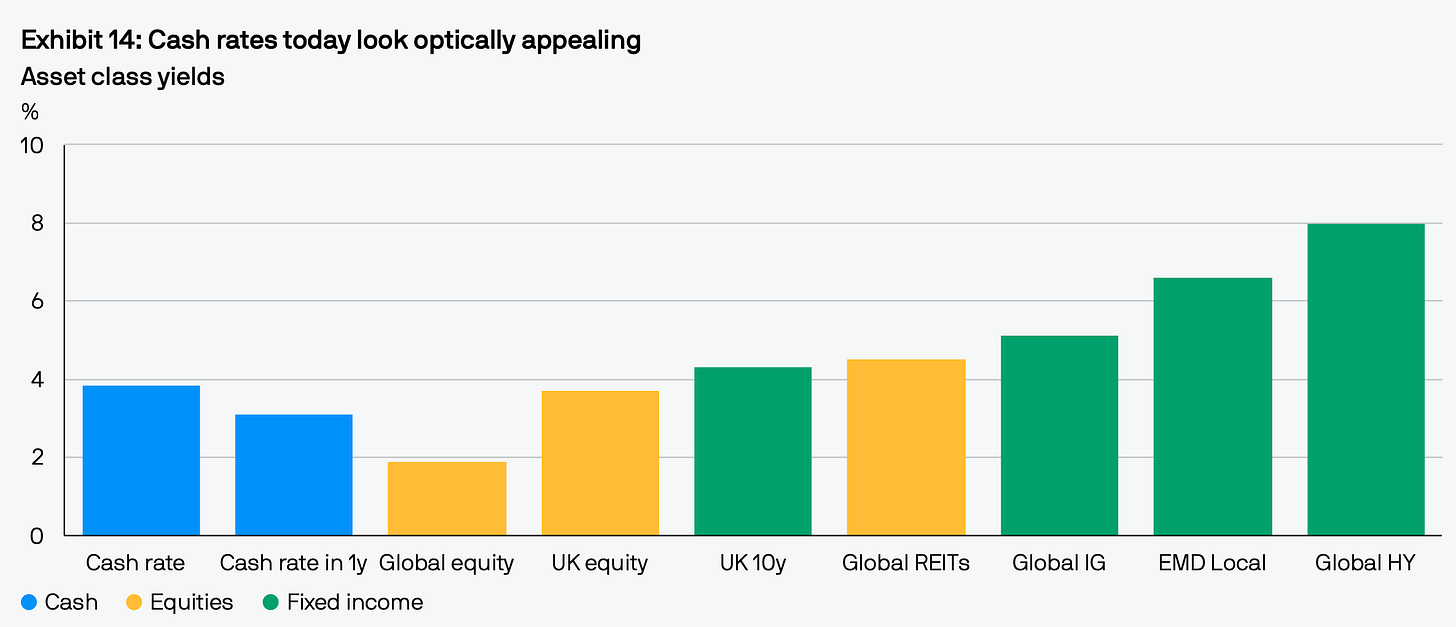
But who cares about stock when you can hang out and earn 8% in high yield?
Especially, if you are a pension fund trying to earn 7%.
Don’t you go 40% into high yield and lock it in?
The rest of the JP Morgan charts are in the presentation.
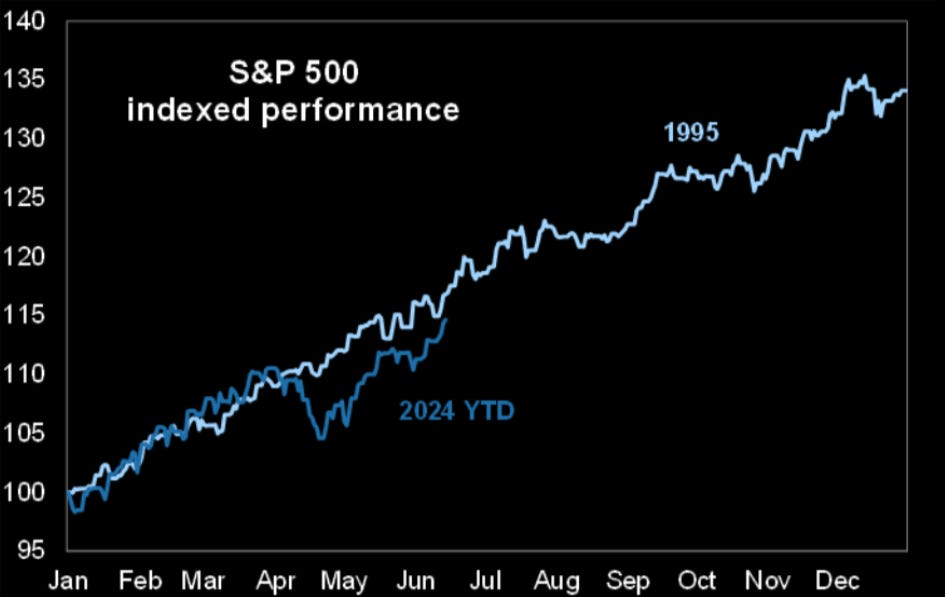
The 1995 Analog
These consensus value calls sound good, but they’ve been painfully wrong.
Who cares about cheap stocks in Europe when NASDAQ is + 20% ytd and it’s June!
It’s a healthy mental exercise to take the other side and argue why the tech melt up continues.
Let’s look at how NASDAQ ends the year +30% and leaves value, EM, China and Europe in the dust again.
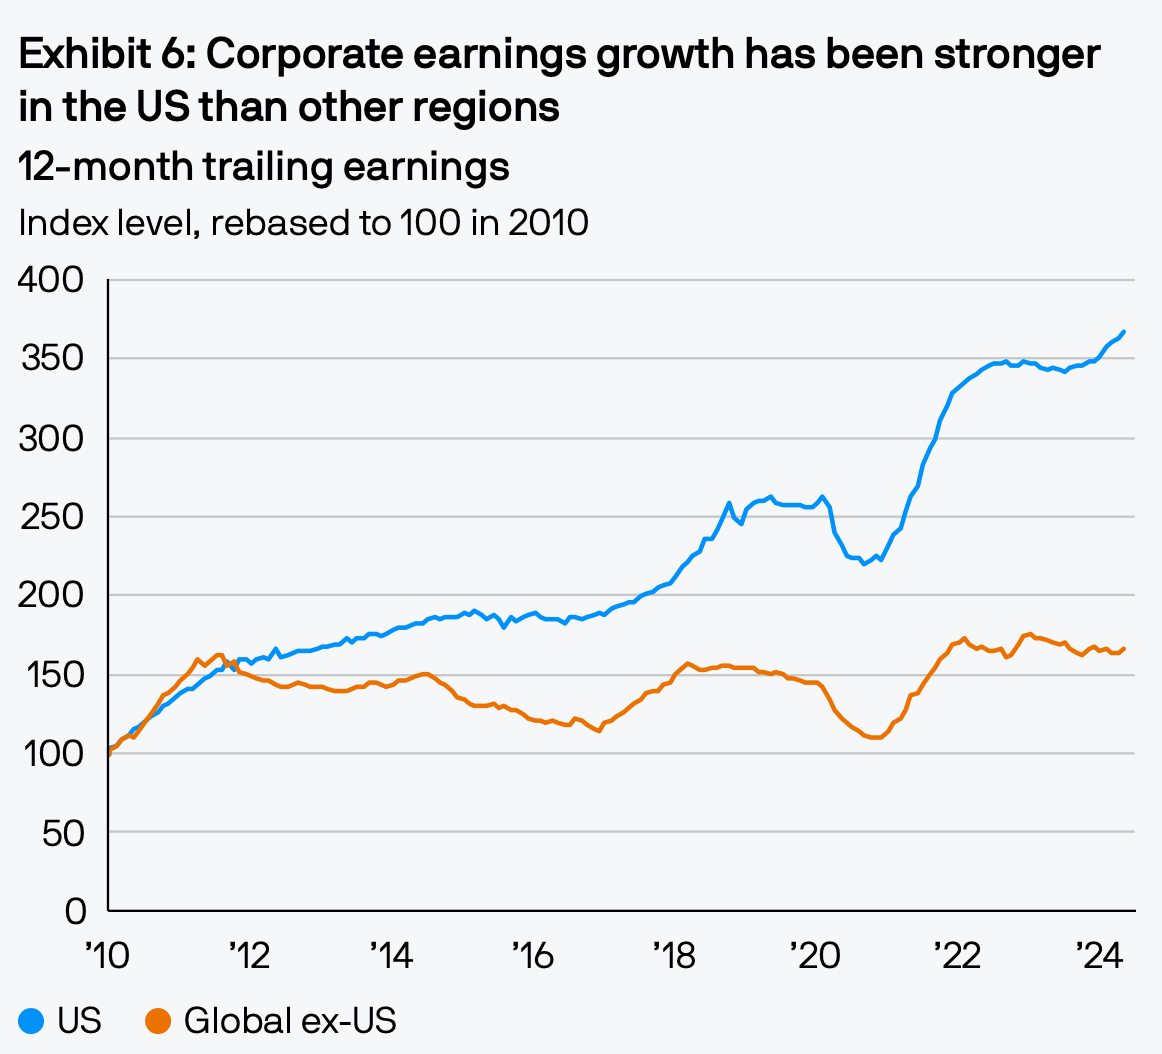
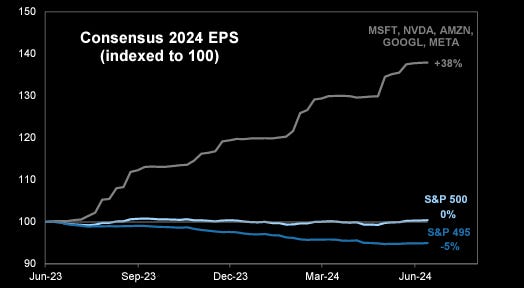
The Rest of the market might be cheap, but has no earnings momentum.
And stop whining about market breadth.
Who says equity performance has to be equal?
It’s a winner take all world. Look at MegaTech EPS revisions versus everyone else.
These are the best businesses in the world and they are about to gain super human intelligence.
Stop resisting. Close the underweight.
MegaTech will continue to outperform….for years.
And meanwhile what if that cash on the sidelines starts to pile into the market and we melt up even further?
Maybe we need a reminder of what bubble valuations really look like. What if MSFT goes back to 60x earnings?

The BofA Survey says investors are bullish, but it’s not extreme.
BofA says tech allocations are about average.
The rest of the BofA charts are in the presentation.
The YWR Auto Theme
One of our non-consensus views is that auto sales can grow for years even though we aren’t supposed to own cars.
US car sales are +3.6% YTD, which doesn’t seem like much, but when you consider the change in interest rates on auto loans, it’s surprisingly resilient.
European and Chinese auto sales are up too YTD.
Meanwhile, auto stocks trade on P/E’s of 5-6x.
I’ve put sales charts for the US, Europe and China in the presentation, as well as which manufacturers are doing well in each market.
Spoiler alert: Mercedes isn’t doing so hot.
But enough of my views.
Make yourself a coffee and go though everything yourself.
Link below to the full presentation.


