Disclosure: This is market commentary. In no way should it be considered investment advice or guidance. For that seek professional help!
This week we will:
Review the state of S&P earnings,
Flag a backdoor renewables infrastructure play and then,
5 charts on why we might have a short-term top in the S&P 500.
Let’s rock.
S&P 500 Earnings
I like this chart. It’s a healthy reminder that long-term stock prices follow earnings.
From here we need to see some earnings growth or this rally falls flat.
Q3 2023 is a key inflection point. It’s where earnings (are expected to) resume year over year growth.
That Q3 $55.82 number needs to hold and not slip to $54, which would mean more negative yoy earnings…and the question…
‘Why do we keep paying such a high P/E for the S&P? Is it going ex-growth? Should we be thinking about other markets..?’
Full year estimates trending down (they usually do slightly), but $246/share in 2024 would still be 12% growth.
At the stock level interesting to see autos and airlines doing well. Autos and airlines have been key takeaways from the YWR Factor model. Ford also showed up in our Hedge Fund Short Squeezer screen. Homebuilders also killing it as they are the only source of homes for sale.
No big takeaway for me from this list, but interesting to see.
Cables: the backdoor renewable play.
All these remote wind projects and solar installations need electric cabling …
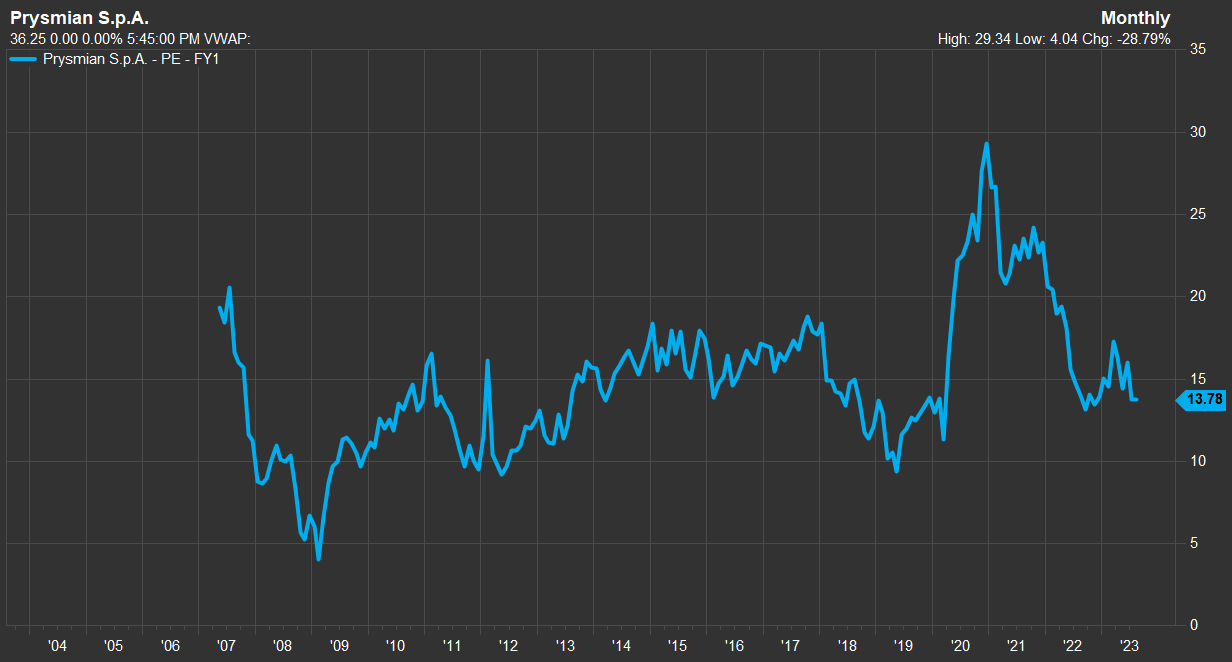
..and it made me take a look at Prysmian in Italy.
Prysmian manufactures a mix of cables for everything and the main part of the business is cables for communications (subsea has been big), but they are also seeing demand for renewables.
The backlog has jumped substantially to an all time high of EUR 9.1 bn. EUR 4.4bn to EUR 6.6bn to EUR 9.1bn in 2 1/2 years.. that’s some substantial momentum.
Forward P/E is not in value territory, but not unreasonable.
Something to consider if you want RARP (renewables at a reasonable price).
5 Charts Suggesting a short-term top in the S&P 500
We’ve just seen a historic hedge fund short squeeze (92nd percentile).
“July is tracking to be one of the largest active de-grossing months for hedge funds in recent years (92nd percentile on a 10-year lookback) driven by short covers and to a lesser extent long sales (3 to 1).” Source: Goldman Prime
Hedge fund short positions outperformed Mega-Tech by 18% in July…. that’s pain… and it’s why we’ve seen this sudden spike higher in the market as hedge funds rapidly shrink their books and close out shorts.


