
YWR: Killer Charts

It’s your monthly Killer Charts pack (75 slides).
This month Killer Charts covers:
Sentiment
BofA Fund Manager Survey (October)
S&P Earnings Estimate Trends
Private Credit
JP Morgan 2025 Outlook (Private Bank)
Nvidia Presentation
Get your double shot latte this weekend and go over all the charts.
But first I want to share some key slides and the story they tell.
Because I see a new boom in the making.
The backdrop
Markets seem exuberant after Trump's win, but actually sentiment isn’t extreme. Yes, some are bullish, but an equal number are hesitant.

The problem is investors still aren’t sure about the economy.
Investors are gradually getting more positive on the economy in 2025, but they are still skeptical.
.
RESEARCH")
Same thing with CPI. Maybe CPI can be a little higher in 2025… but this is coming from record low inflation expectations just 1 month ago.
 will be higher
Net % of FMS investors expecting higher inflation
100
80
60
40
20
-20
-100
'95 '97 '99 m '03
Sotrce WA Globd rund Mamgg Survey.
—Net % Expecting Higher Global CPI
'15
Net 16% expect global CPI to be lower in 12
months' time, down 28ppt in the past month
(and down 51 ppt in the past 2 months).
Nov 24 inflation expectations are the highest
since Mar' 22.
Post-election respondents expect global
inflation to head higher, for the first time
since Aug' 21 (net 10%).
'21 '23 '25
BofA GLOBAL RESEARCH")
But what could cause a better than expected economy in 2025?
Another key chart from the BofA survey.
Investors don’t think companies are over leveraged…. record lows in junk bond credit spreads tell us the same thing.
.
25
Smrce: BofA Fund Marag« Survey
BofAGL08AL RESEARCH")
Best Assets for 2025
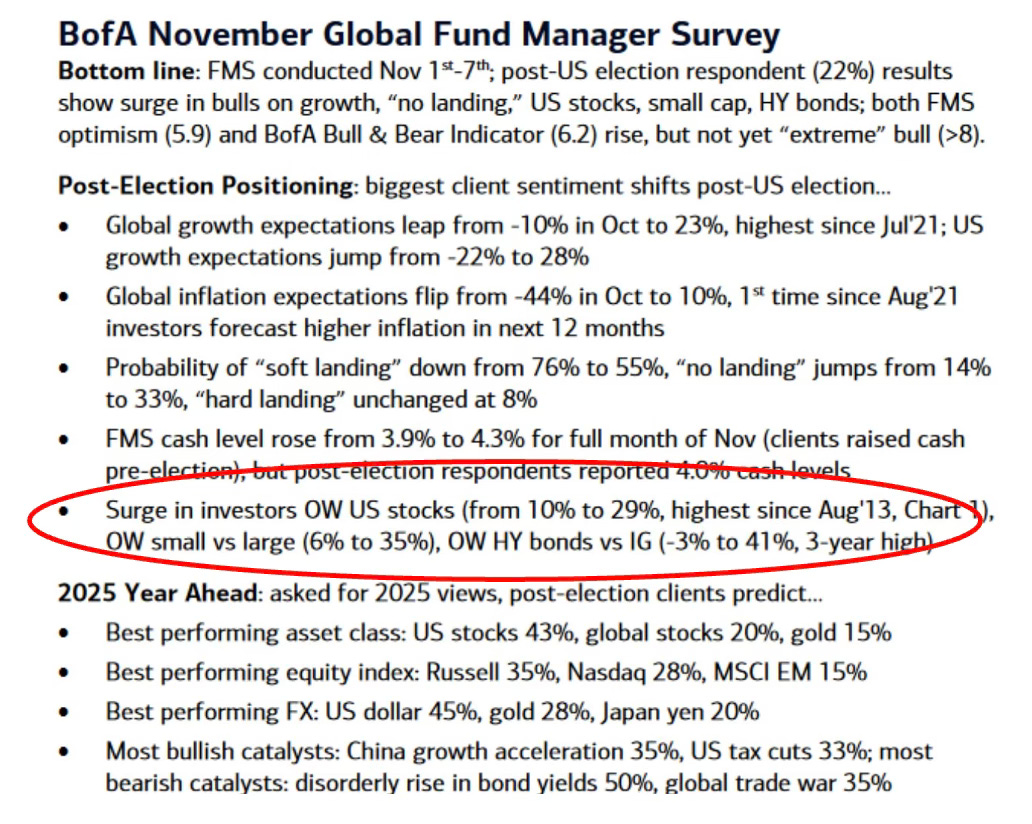
Their outlook for the ecomomy might be mixed, but investors are much more confident about stock prices.
After a +52% move in the S&P 500 since December 2022 investors think US Stocks will be the best performing asset in 2025. Very little interest in China as usual.
Big investor overweights in US equities and high yield.
US equities earnings estimates show slight deterioration, but still forecasting 15% EPS growth for 2025.

A forward P/E of 22x doesn’t seem like a great starting point for US equities to be the best performing asset in 2025.

다
로
그
p
0
11서4i2014
01서4i2015
0퍼3i2015
0원11i2015
07!0털2015
0떻0기2015
1미29i2015
12%!2015
02t25i2016
04t2기2016
0하2이2016
0텐1하2016
1미1기2016
12t0털2016
0기07i2017
0405!2017
0하0기2017
07!취i2017
0떻26i2017
11!21i2017
01!2기2018
이2이2018
0원16i2018
0瀰3i2018
0희1이2018
11!05i2018
01!04i2019
이05!2019
0원01i2019
0털27i2019
0친23i2019
1민21i2019
1기17i2019
0기14i2020
04.너4i2020
0하1이2020
이06/2020
1미0기2020
11!3이2020
01!28i2021
이26!2021
0교24i2021
07!21i2021
0희16i2021
11서N2021
01서이2022
이09i2022
0원05i2022
07!05i2022
0일3이2022
1미26i2022
12t2기2022
02t2기2023
04t2이2023
0다16i2023
0鬧5i2023
1민11i2023
1기07i2023
02t0하2024
0404i2024
0원31i2024
07!3이2024
0년25i2024
卜)
0
0
0
0
0
0
0
0
0
0
0
0
0
0
0")
In the JP Morgan outlook for 2025 they see a set up where capital markets could be stronger next year with more issuance of leveraged loans, high yield and IPO’s. Should be good for Barclays.

But what picture is this painting?
Are US Equities really going to be the best asset class for 2025?
And how does Nvidia fit into this?
First, one more chart from the JP Morgan 2025 Outlook because it fits with the BofA chart on corporate leverage.
