YWR: Killer Charts
Disclosure: Personal Views. Not investment recommendations.
Good morning. Let’s get into the charts. We will look at an apparent contradiction and the big set up it presents.
The contradiction:
The S&P 500 has been trading surprisingly well through a decline in earnings expectations and much higher returns on cash. With the ability to earn 5% on your cash I have expected the index to be trading closer to $3,500 (a P/E of 15x). But as you see in the chart above, valuations haven’t been a factor. The S&P is closely tracking earnings which aren’t growing, but have stopped declining.
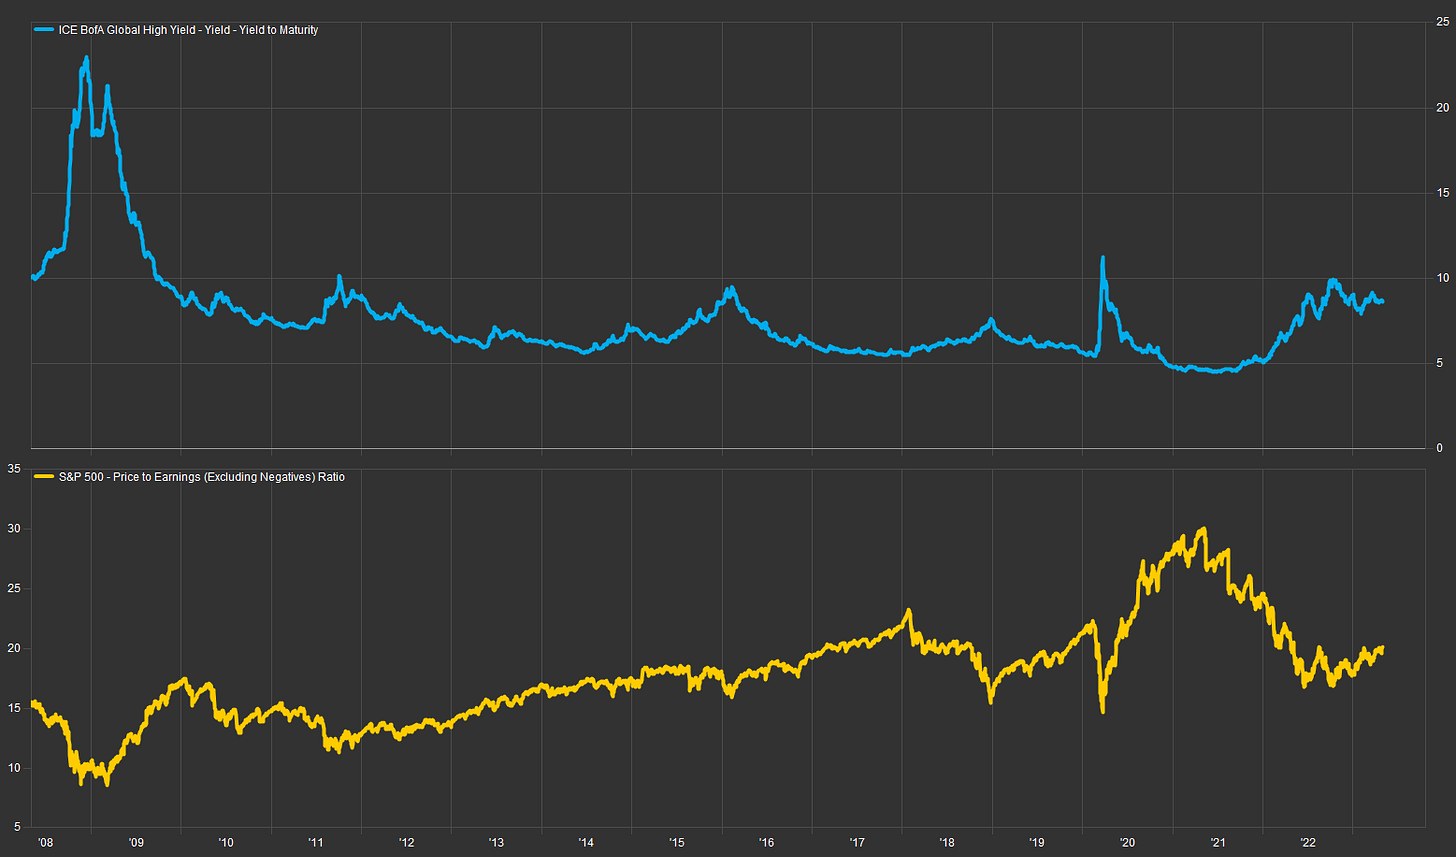
Below you see the S&P is on a P/E of 18x (orange line) while you can earn 8% in high yield (blue line). The two assets are relatively similar. It makes high yield look relatively attractive and the S&P expensive.
The valuations on the S&P 500 and the fact it continues to rally makes you think investors are being irrationally exuberent.
Don’t they realize the market is expensive? Don’t they see that every week a new high profile bank is collapsing? Don’t they see a new GFC is happening? Don’t they see the drop in the ISM? And on an on…..
They do. This is the paradox…and the big set up.
Actually investors and hedge funds are extremely bearish and defensively positioned…
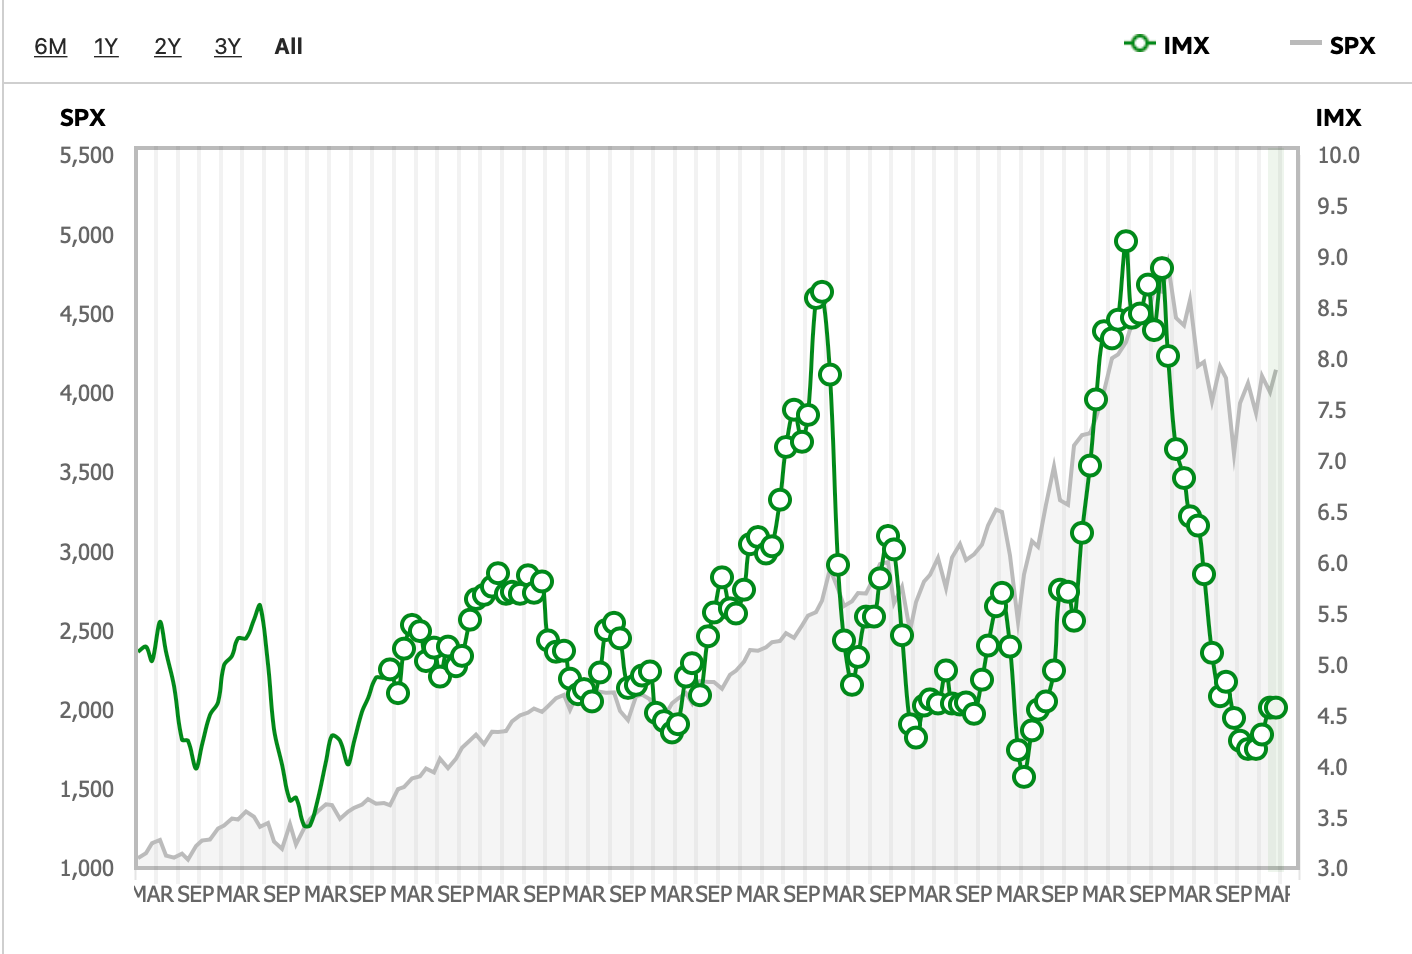
Below is Ameritrade’s new IMX index which measures the activity of their 11 million accounts. This is through March. It’s 4.6, just a bit off the March 2020 low of 3.9.
Look at Goldman’s hedge fund positioning data in US Equities. Same thing.
Look at the ratio of 6 month out volatily relative to spot. It’s really high. That’s investors expecting a high volatility crash and paying up for protection. Another sign of high levels of bearishness.
In fact the entire US yield curve is positioned for a big recession.
Here’s what I think.


