YWR: Your Weekend Reading

YWR: Your Weekend Reading

YWR: Killer Charts

Vertical earnings growth and the mega trend investors refuse to buy.

Erik's avatar
Erik
Aug 21, 2026
∙ Paid

Let’s go over the biggest trend no one is buying.

But first we need to eat our vegetables.

The month’s chart pack is 38 charts covering:

  • BofA Survey highlights

  • S&P 500 Earnings estimates

  • Market Perspective charts

  • Labor Productivity

  • The Biggest Trend no one is buying.

By eating our vegetables I mean we check in on those key charts which keep us in the trade for S&P $10,000.

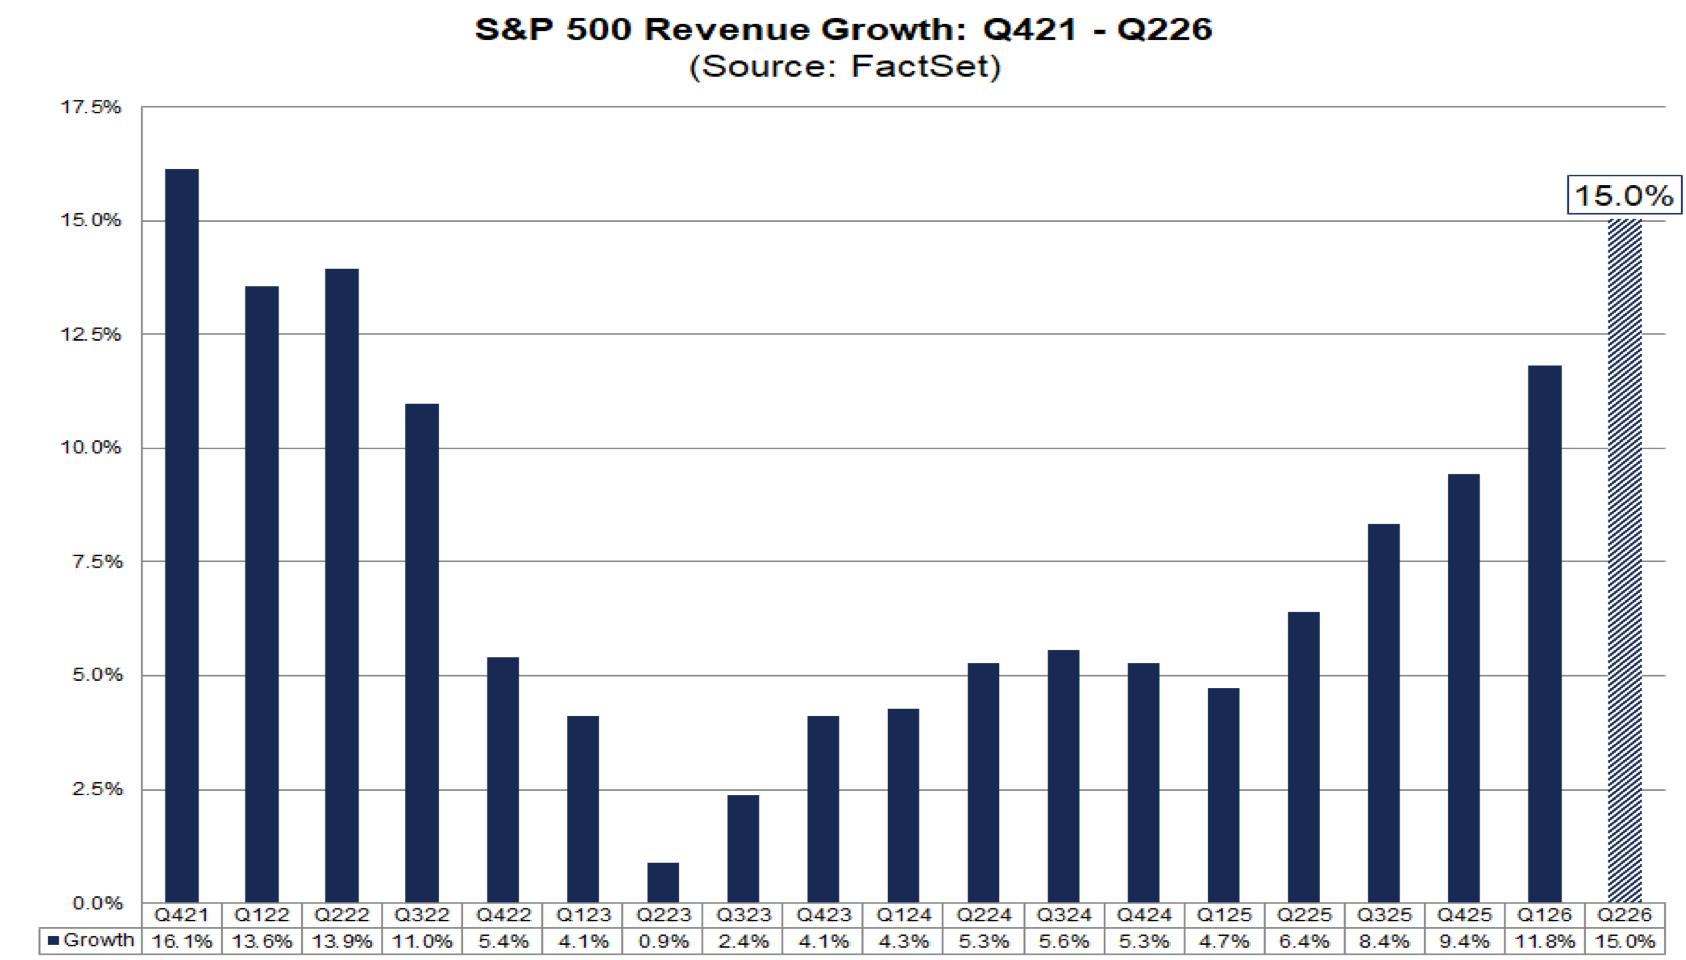
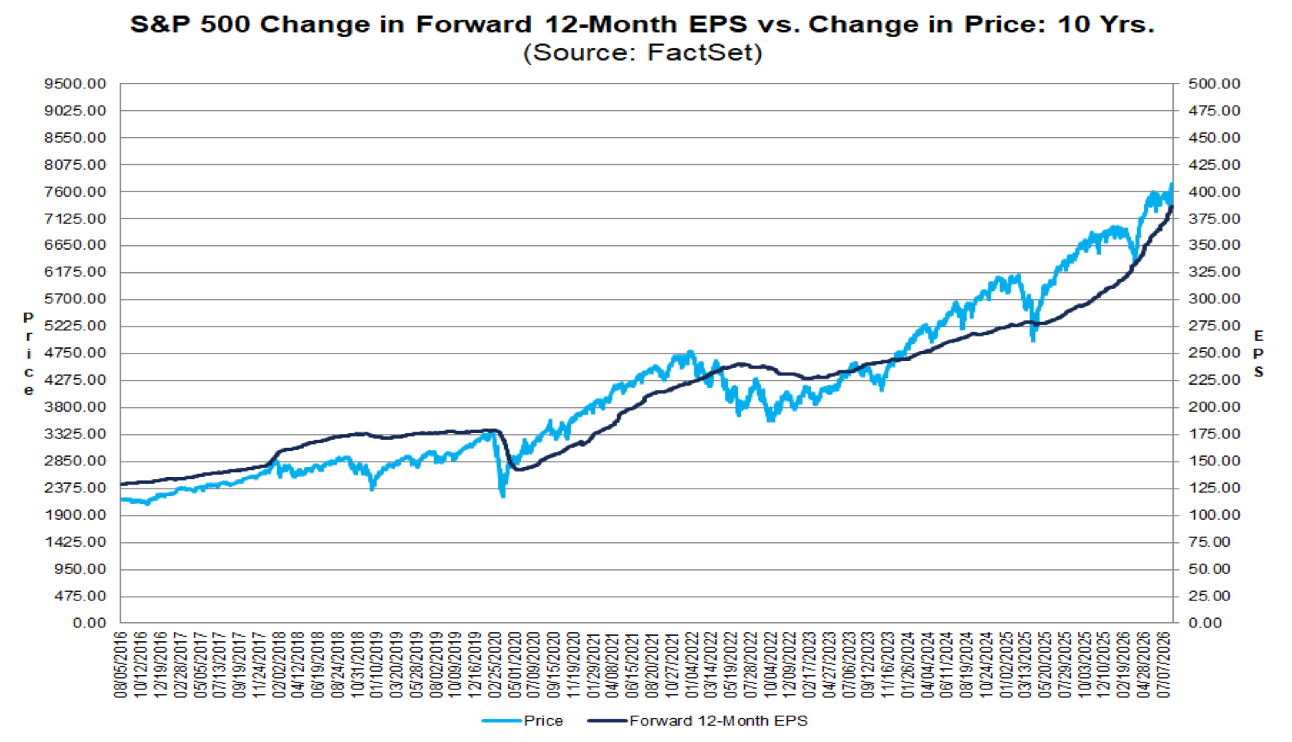
#1 Earnings estimates are going vertical.
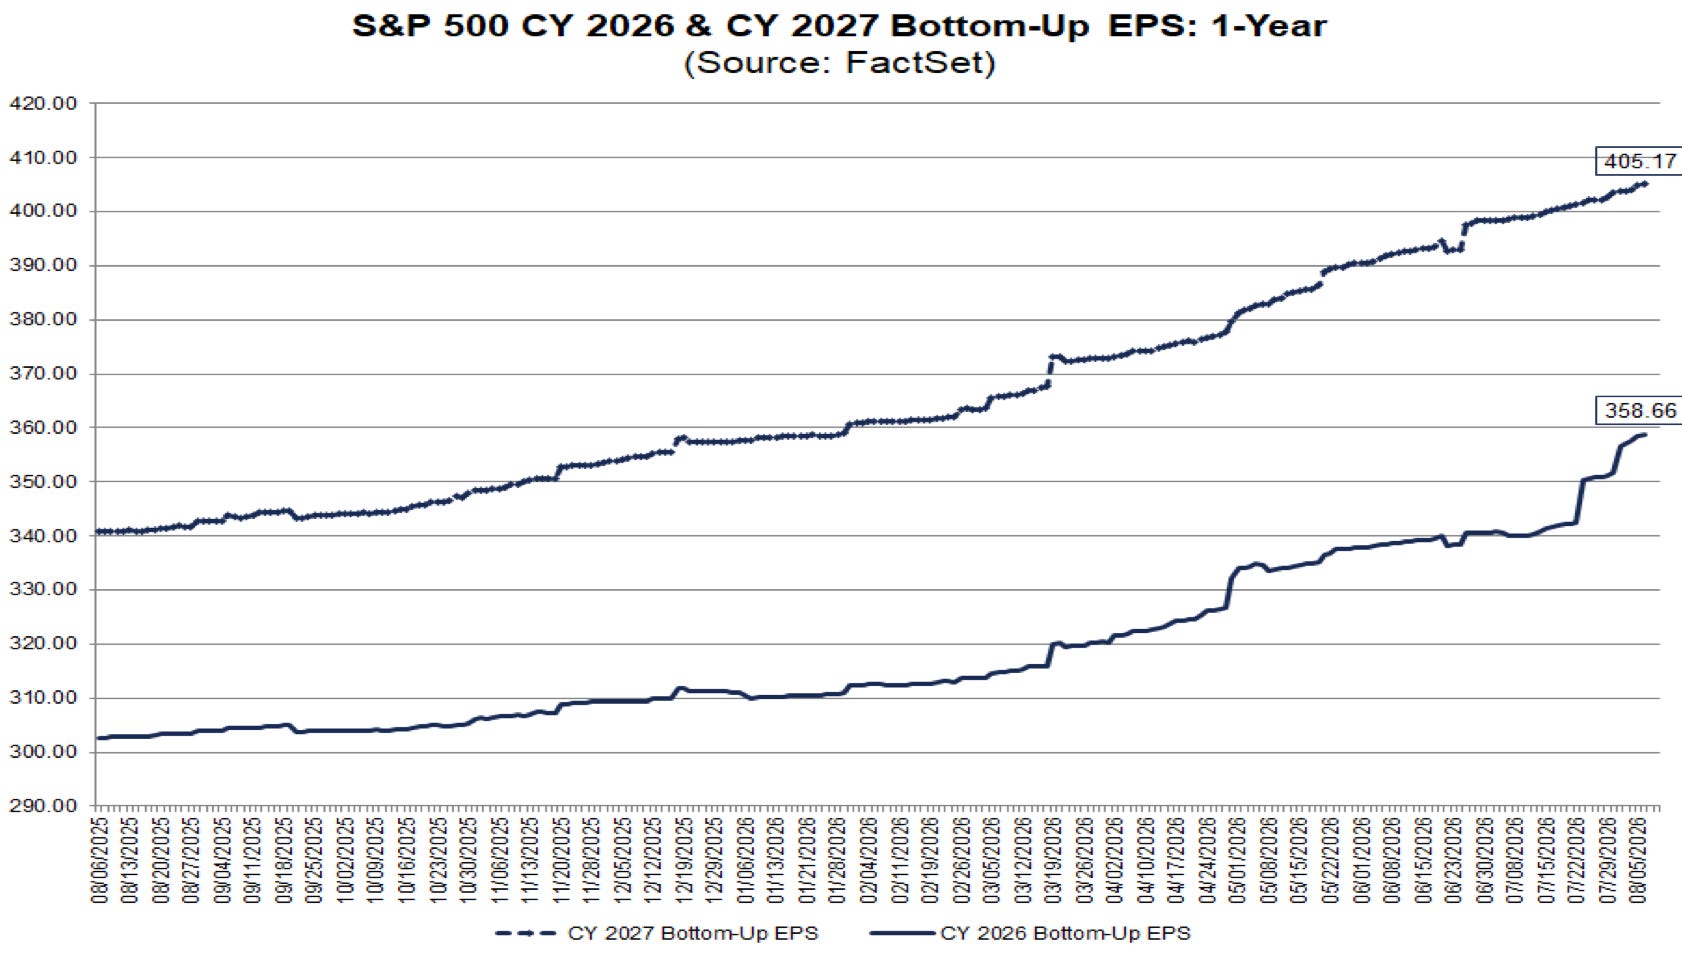
#2 Earnings estimate revisions are positive.
420.00 
390.00 
380.00 
340.00 
410.00 
370.00 
330.00 
360.00 
300.00 
290.00 
400.00 
320.00 
310.00 
350.00 
08/06/2025 
08/13/2025 
08/20/2025 
08/27/2025 
09/04/2025 
09/11/2025 
09/18/2025 
09/25/2025 
10/02/2025 
S&P 500 CY 2026 & CY 2027 Bottom-Up EPS: 1-Year 
10/09/2025 
10/16/2025 
10/23/2025 
10/30/2025 
11/06/2025 
--- CY 2027 Bottom-Up EPS 
11/13/2025 
11/20/2025 
11/28/2025 
12/05/2025 
12/12/2025 
12/19/2025 
(Source: FactSet) 
12/29/2025 
01/06/2026 
01/13/2026 
01/21/2026 
01/28/2026 
02/04/2026 
02/11/2026 
02/19/2026 
-CY 2026 Bottom-Up EPS 
02/26/2026 
03/05/2026 
03/12/2026 
03/19/2026 
03/26/2026 
04/02/2026 
04/10/2026 
04/17/2026 
04/24/2026 
05/01/2026 
05/08/2026 
05/15/2026 
05/22/2026 
06/01/2026 
06/08/2026 
06/15/2026 
06/23/2026 
06/30/2026 
07/08/2026 
07/15/2026 
07/22/2026 
358.66 
07/29/2026 
405.17 
08/05/2026

#3 Revenues accelerating

S&P 500 Revenue Growth: Q421 - Q226 
(Source: FactSet) 
17.5% 
15.0% 
15.0% 
12.5% 
10.0% 
7.5% 
5.0% 
2.5% 
0.0% 
Q421 
Q122 
Q222 Q322 Q422 Q123 
Q223 
Q323 
Q423 
Q124 
Q224 
Q324 
Q424 
Q125 Q225 Q325 
Q425 Q126 
Q226 
Growth 
16.1% 
13.6% 
13.9% |11.0% 
5.4% 
4.1% 
0.9% 
2.4% 
4.1% 
4.3% 
5.3% 
5.6% 
5.3% 
4.7% 
6.4% 
8.4% 
9.4% 
11.8% 
15.0%

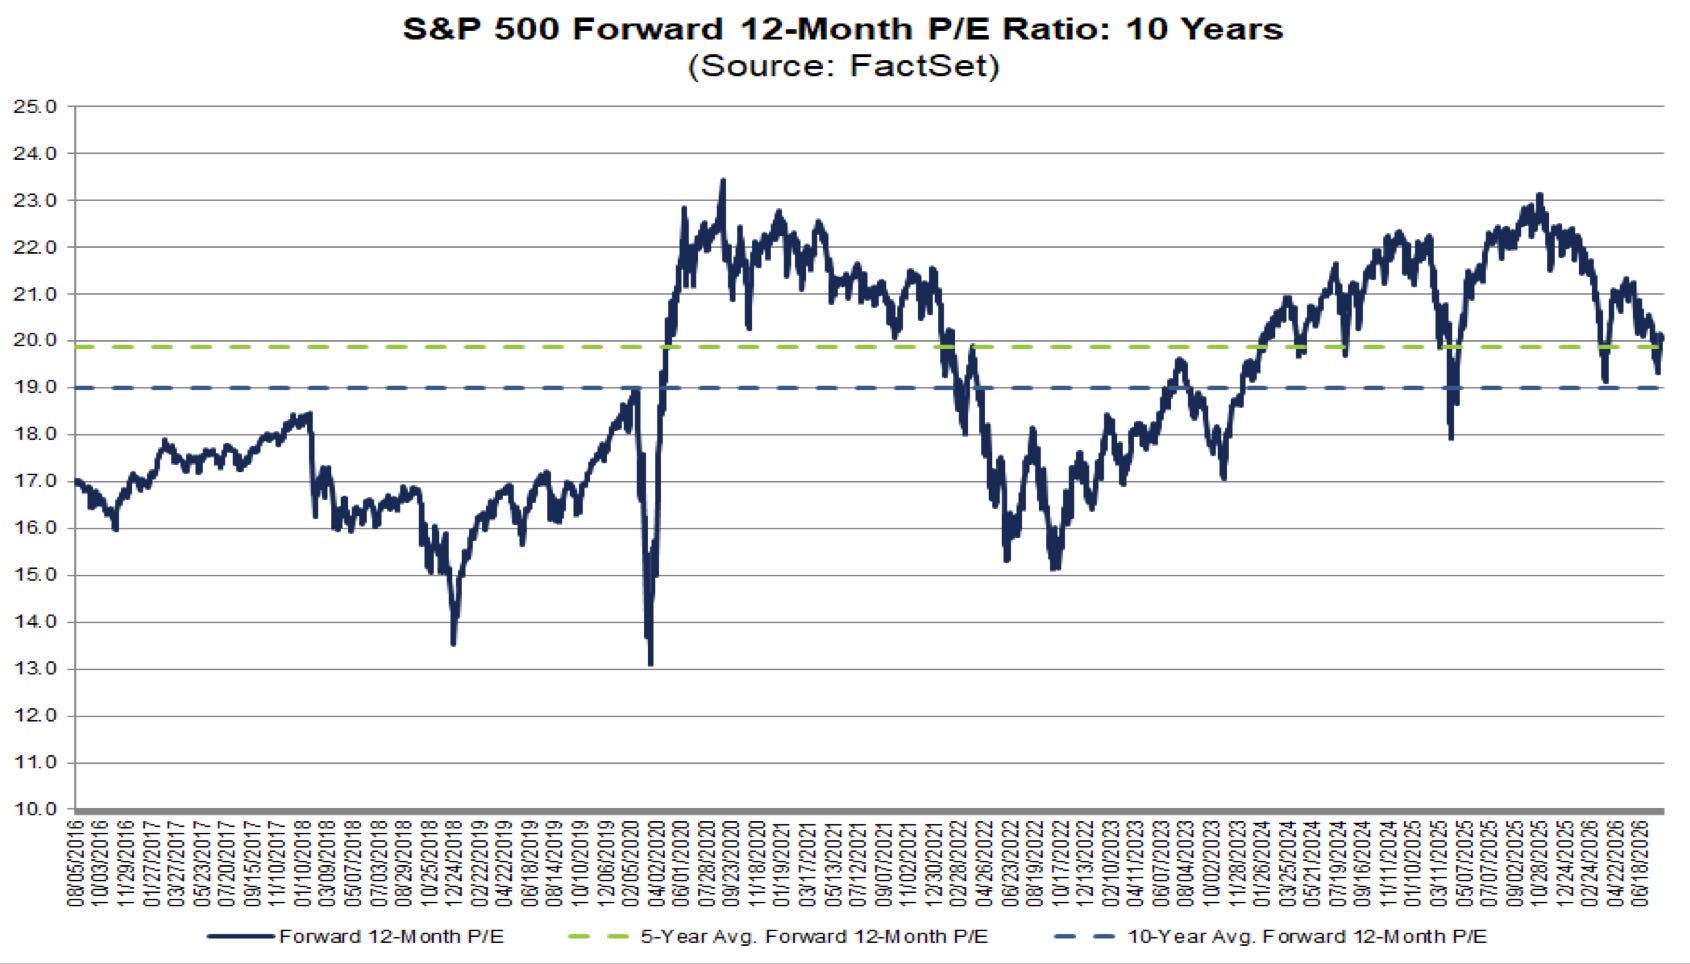
#4 Market can’t keep up with 30% earnings growth (P/E derating)
25.0 
24.0 
22.0 
23.0 
20.0 
21.0 
16.0 
18.0 
19.0 
17.0 
14.0 
12.0 
11.0 
10.0 
15.0 
13.0 
08/05/2016 
10/03/2016 
11/29/2016 
01/27/2017 
03/27/2017 
05/23/2017 
07/20/2017 
09/15/2017 
11/10/2017 
Forward 12-Month P/E 
01/10/2018 
03/09/2018 
05/07/2018 
07/03/2018 
08/29/2018 
S&P 500 Forward 12-Month P/E Ratio: 10 Years 
10/25/2018 
12/24/2018 
02/22/2019 
04/22/2019 
06/18/2019 
08/14/2019 
- - 5-Year Avg. Forward 12-Month P/E 
10/10/2019 
12/06/2019 
02/05/2020 
04/02/2020 
06/01/2020 
(Source: FactSet) 
07/28/2020 
09/23/2020 
11/18/2020 
01/19/2021 
03/17/2021 
05/13/2021 
07/12/2021 
09/07/2021 
11/02/2021 
12/30/2021 
02/28/2022 
04/26/2022 
06/23/2022 
08/19/2022 
10/17/2022 
- - 10-Year Avg. Forward 12-Month P/E 
12/13/2022 
02/10/2023 
04/11/2023 
06/07/2023 
08/04/2023 
10/02/2023 
11/28/2023 
01/26/2024 
03/25/2024 
05/21/2024 
07/19/2024 
09/16/2024 
11/11/2024 
01/10/2025 
03/11/2025 
05/07/2025 
07/07/2025 
09/02/2025 
10/28/2025 
12/24/2025 
02/24/2026 
04/22/2026 
06/18/2026

In the chart pack there are other useful market perspective charts. I’ve added US bank lending which we need to track. It’s picking up, which is what we want, but the growth rate in lending is still single digits.

When the bubble gets to its later stages we expect to see double digit loan growth.

Now we check in on what the professional investors think.

#5 Bullishness among Institutional investors is near peak levels. It’s concerning. But will the problem be not that the market declines, but fund managers are in the wrong stocks? Probably.
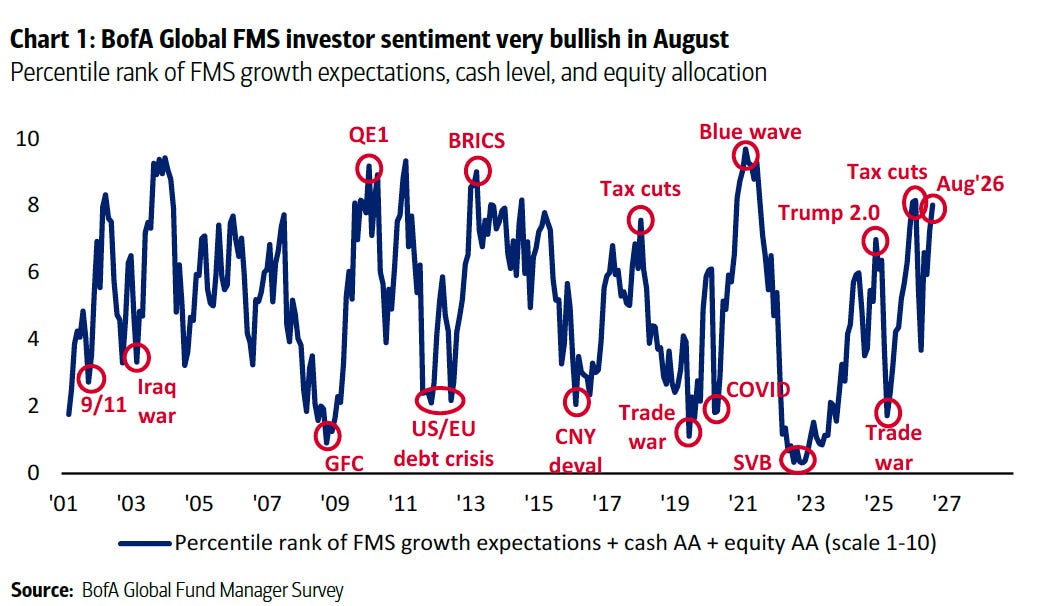
Chart 1: BofA Global FMS investor sentiment very bullish in August 
Percentile rank of FMS growth expectations, cash level, and equity allocation 
10 
QE1 
BRICS 
Blue wave 
Tax cuts 
Tax cuts 
Aug'26 
8 
Trump 2.0 
6 
4 
2 
9/11 
COVID 
US/EU 
Trade 
CNY 
war 
Trade 
0 
GFC 
debt crisis 
deval 
SVB 
war 
'01 
'03 
'05 
'07 
'09 
'11 
'13 
'15 
'17 
'19 
'21 
'23 
'25 
'27 
-Percentile rank of FMS growth expectations + cash AA + equity AA (scale 1-10) 
Source: BofA Global Fund Manager Survey

In the market perspective section note the AAII Bull Bear reading is sitting at average levels. Nothing extreme. So it contradicts the BofA Survey somewhat.

#6 UK is the most hated country.
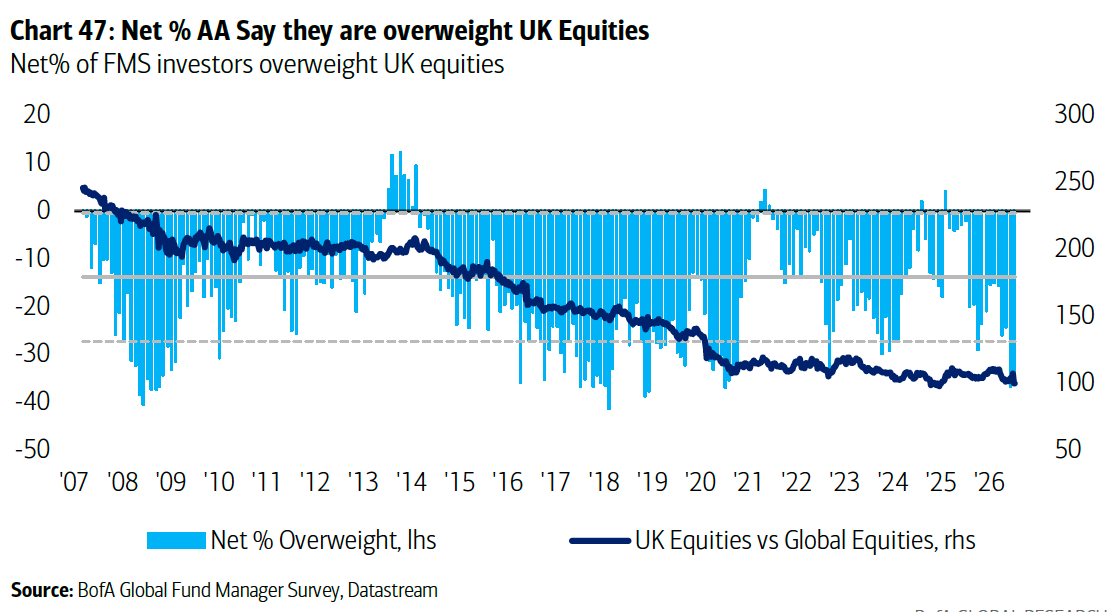
Chart 47: Net % AA Say they are overweight UK Equities 
Net% of FMS investors overweight UK equities 
20 
300 
10 
250 
0 
-10 
200 
-20 
150 
-30 
100 
-40 
-50 
50 
'07 '08 '09 '10 '11 '12 '13 '14 '15 '16 '17 '18 '19 '20 '21 '22 '23 '24 '25 '26 
Net % Overweight, Ihs 
-UK Equities vs Global Equities, rhs 
Source: BofA Global Fund Manager Survey, Datastream

#7 Consumer stocks are the most hated sector
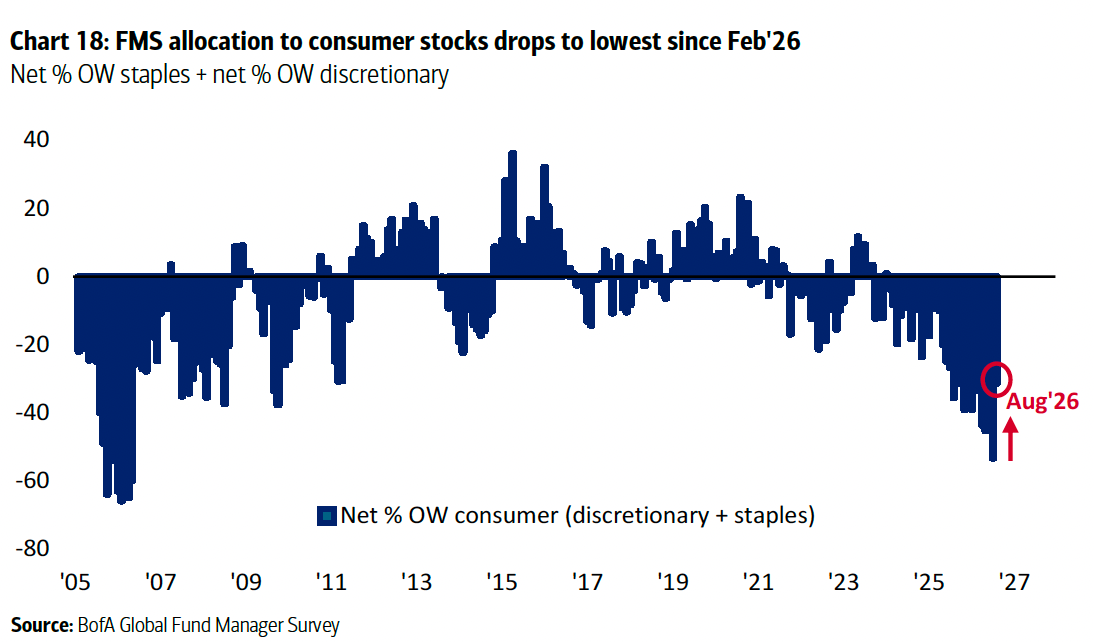
Chart 18: FMS allocation to consumer stocks drops to lowest since Feb'26 
Net % OW staples + net % OW discretionary 
40 
20 
0 
-20 
-40 
Aug'26 
-60 
Net % OW consumer (discretionary + staples) 
-80 
'05 
'07 
'09 
'11 
'13 
'15 
'17 
'19 
'21 
'23 
'25 
'27 
Source: BofA Global Fund Manager Survey

This bearishness around the consumer is highly consensus and positioning is getting extreme. Many of you have been asking about the alcohol stocks. Could alcohol stocks be the next tobacco stocks?

We need to start thinking about the consumer bull case.

Could consumers and wages somehow do better than we expect in the years ahead?

I put some potential consumer bull case charts in the Labor Productivity section in the chart pack.

#8 The labor force declines in the years ahead.
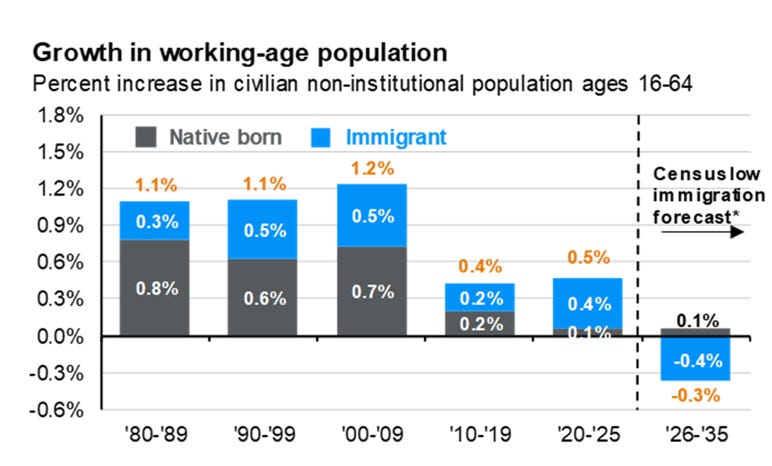
Growth in working-age population 
Percent increase in civilian non-institutional population ages 16-64 
1.8% 
1.5% 
Native born 
Immigrant 
1.2% 
1.1% 
1.1% 
1.2% 
Censuslow 
immigration 
0.9% 
0.3% 
0.5% 
0.5% 
forecast* 
0.6% 
0.4% 
0.5% 
0.3% 
0.8% 
0.6% 
0.7% 
0.2% 
0.4% 
0.0% 
0.2% 
0.1% 
0.1% 
-0.3% 
-0.4% 
-0.6% 
-0.3% 
'80-'89 
'90-'99 
'00-'09 
'10-'19 
'20-'25 
'26-'35

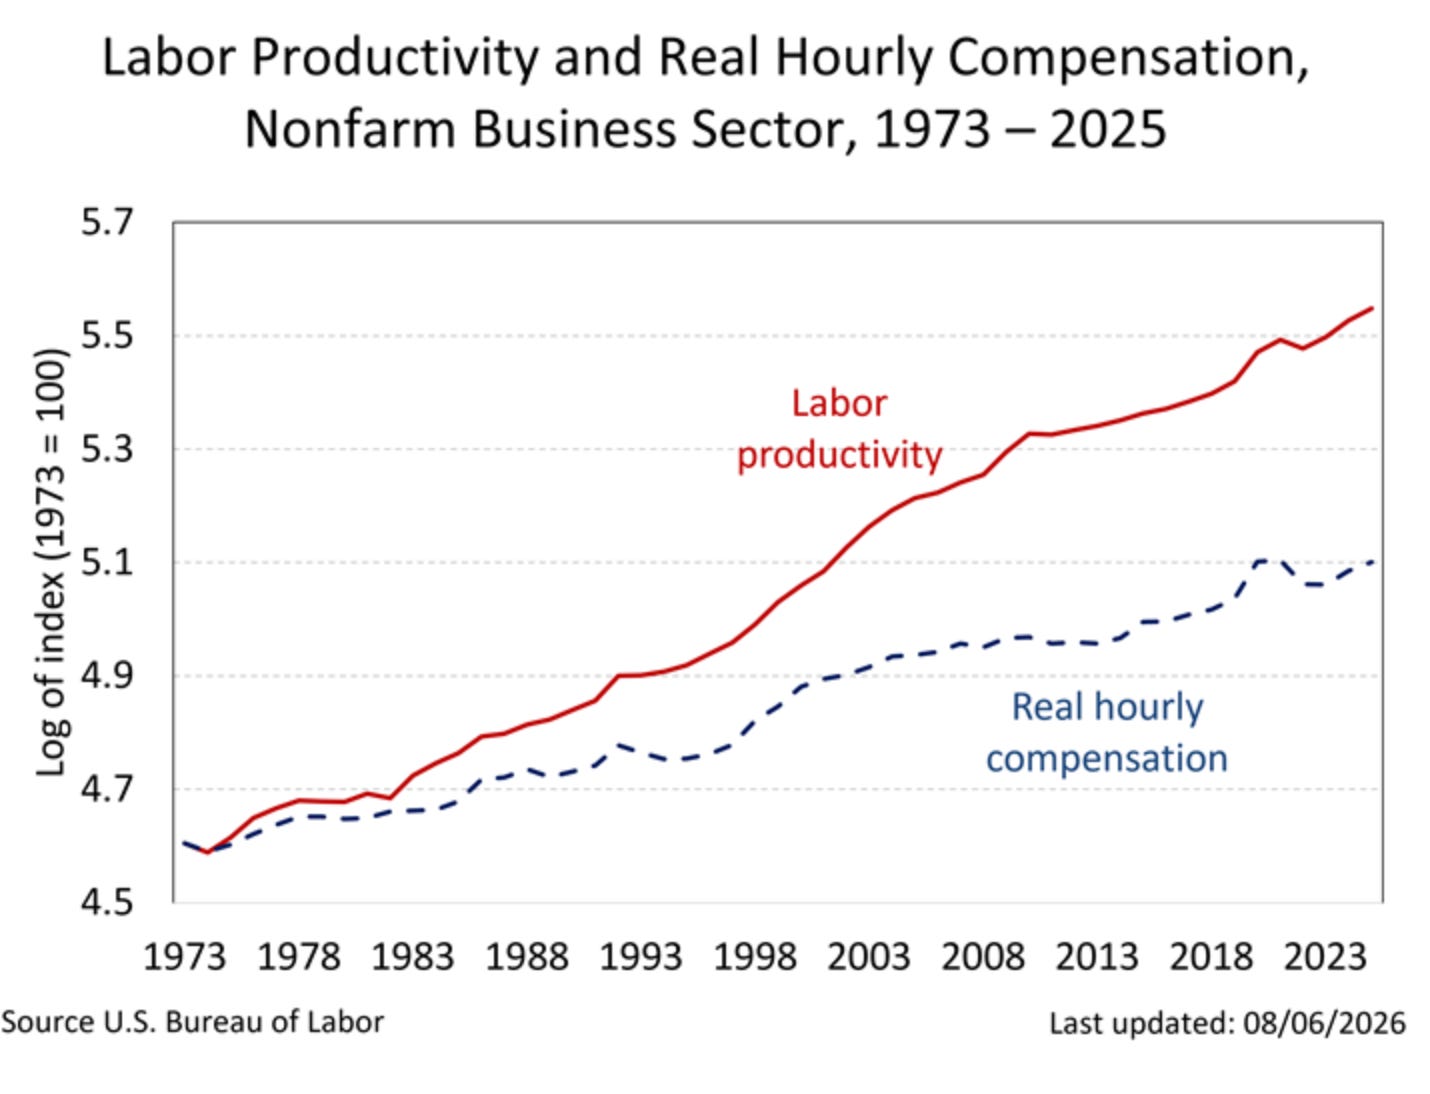
#9 Workers are cheap relative to how efficient they have become.

Have we lost track of the fact that maybe given all the efficiency improvements workers are now a good deal?
Labor Productivity and Real Hourly Compensation, 
Nonfarm Business Sector, 1973 - 2025 
5.7 
5.5 
Labor 
5.3 
productivity 
5.1 
4.9 
Real hourly 
4.7 
compensation 
Log of index (1973 = 100) 
4.5 
1973 1978 1983 1988 1993 1998 2003 2008 2013 2018 2023 
Source U.S. Bureau of Labor 
Last updated: 08/06/2026

And workers will get even more efficient in the year’s ahead with AI.

Now the biggest trend nobody wants to invest in.

User's avatar

Continue reading this post for free, courtesy of Erik.

Or purchase a paid subscription.
© 2026 YWR · Privacy ∙ Terms ∙ Collection notice
Start your SubstackGet the app
Substack is the home for great culture