

It’s been a tough week in the markets.
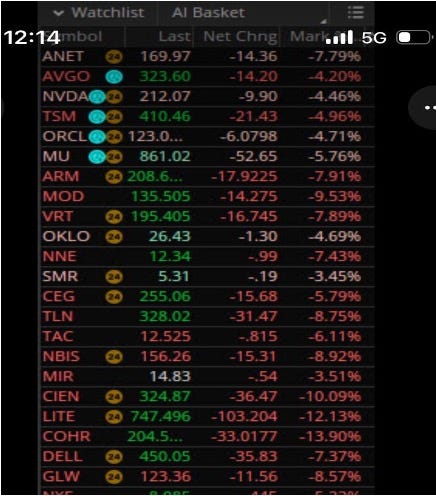
The index hasn’t moved much, but AI names are getting crushed.
Tech investors are questioning everything.
Has the trend changed? Is it time to capitulate?
Yes, the technology is great and in the future we will all use AI, but in the meantime do rising bond yields and credit spreads crash the party?
Do we go down another 40% before we go up?
Is this 1999 all over again?
That’s the question. Right?
Let’s go over highlights from this month’s 58 slide chart pack.
We will do a health check and come to a conclusion.
October’s Killer Charts include sections on:
S&P 500 Earnings Estimates
Positioning
US Housing
Coatue Public Markets Update
Ramp AI data
A link to the full chart pack is at the bottom of the post.
Let’s build this up piece by piece.
We review S&P 500 earnings estimates every month. Like a doctor checking your heart rate and blood pressure.
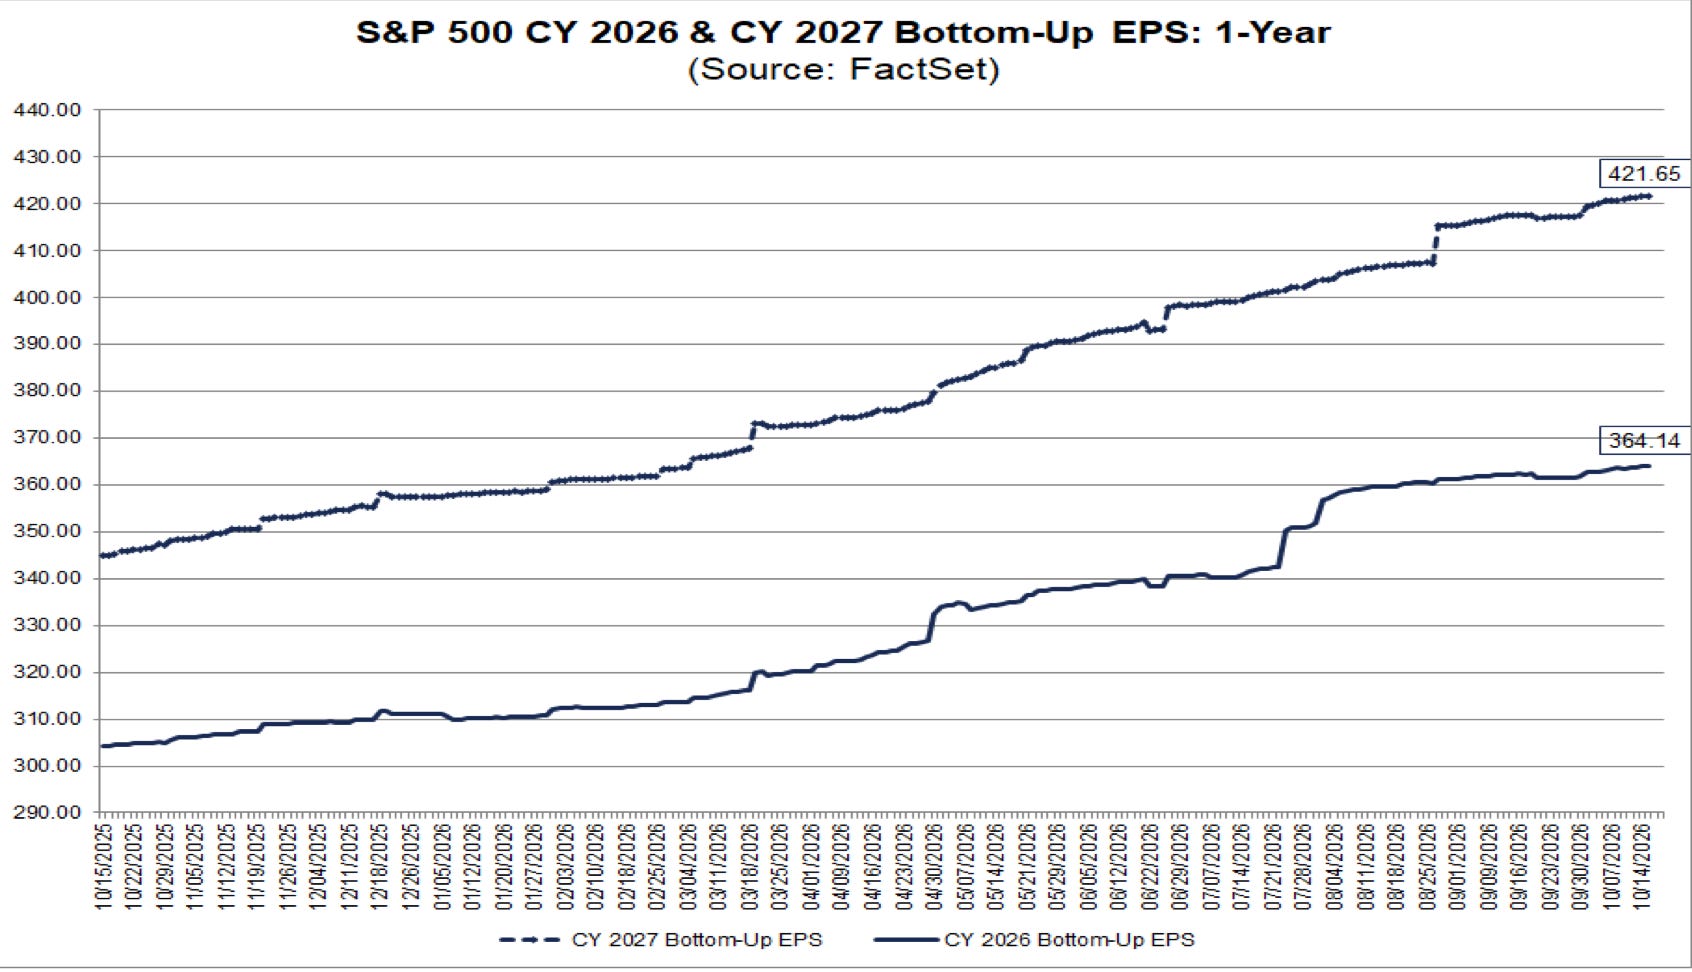
Earnings estimates show strong growth and positive revisions.
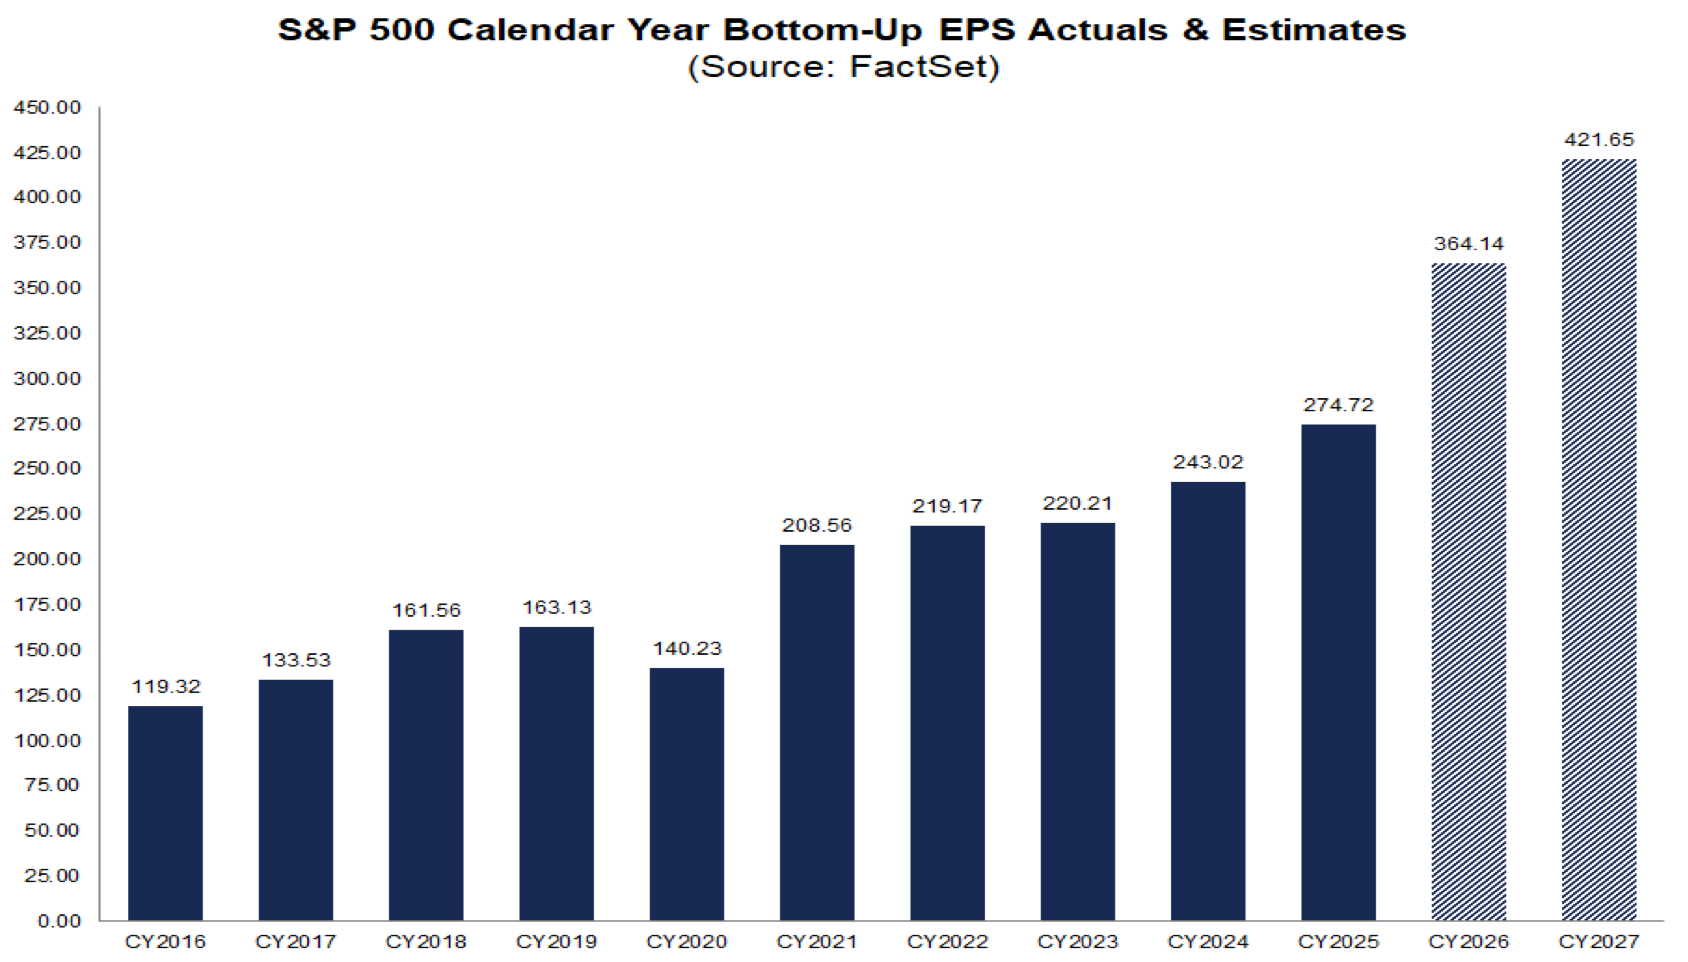
EPS growth for the market is accelerating. Earnings are going to grow 32% in 2026! That is amazing.
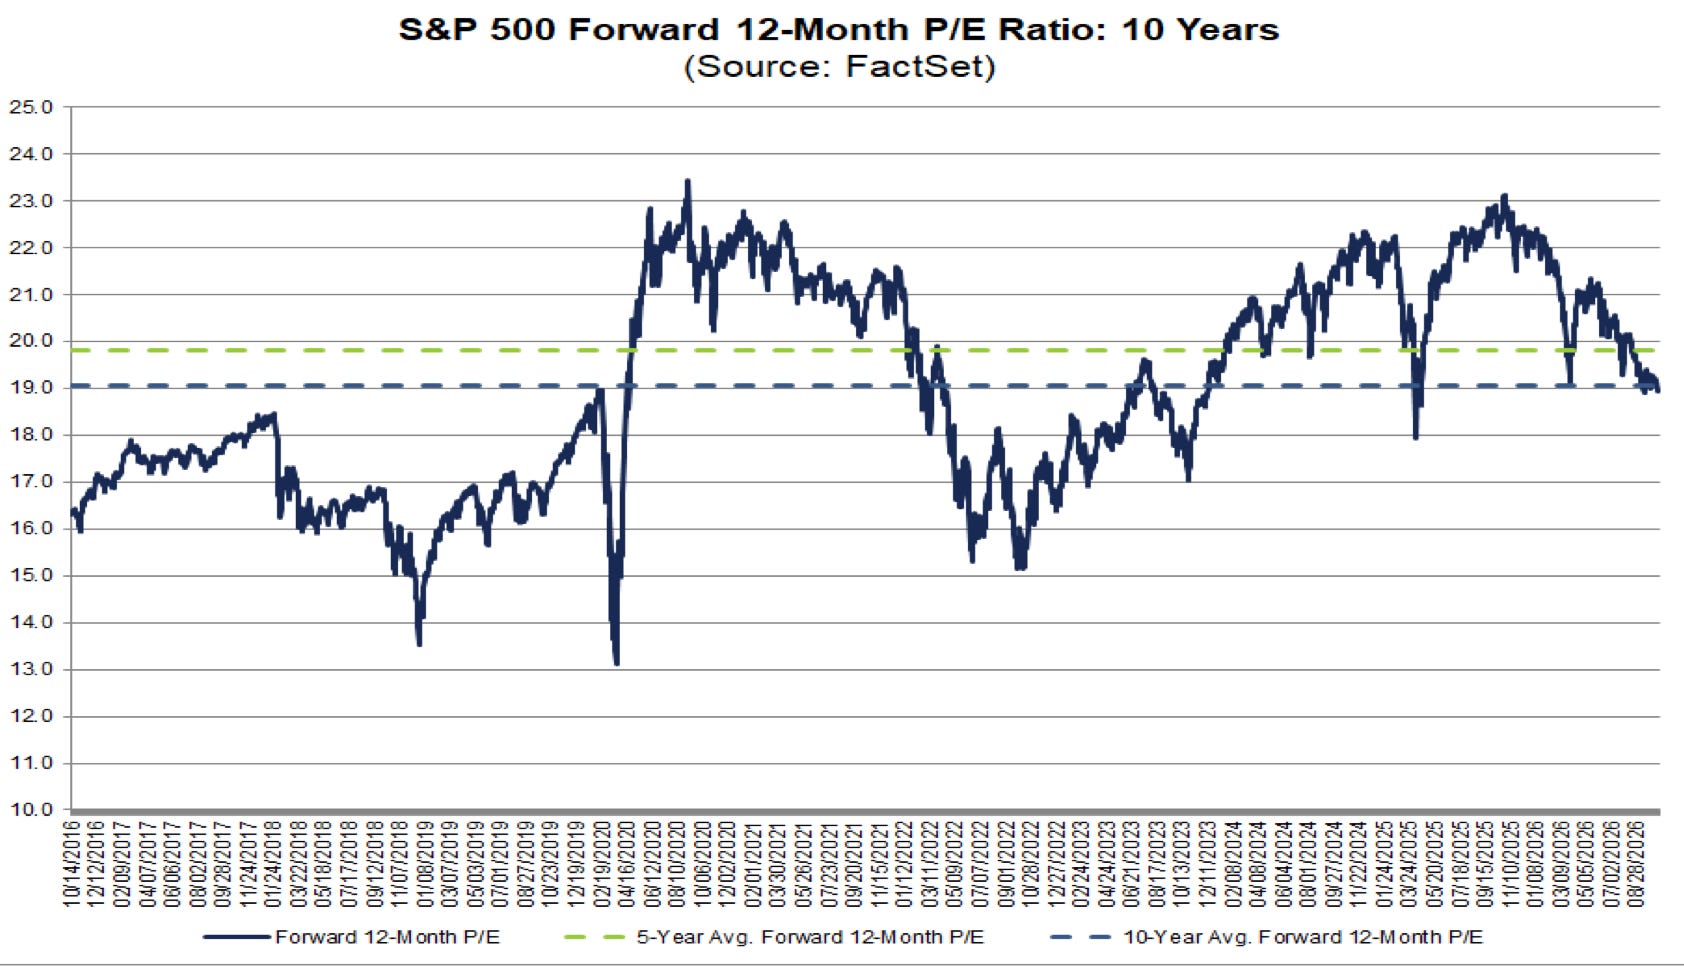
Earnings are growing rapidly, while the market goes sideways, which means valuations are compressing. This is a positive set up.
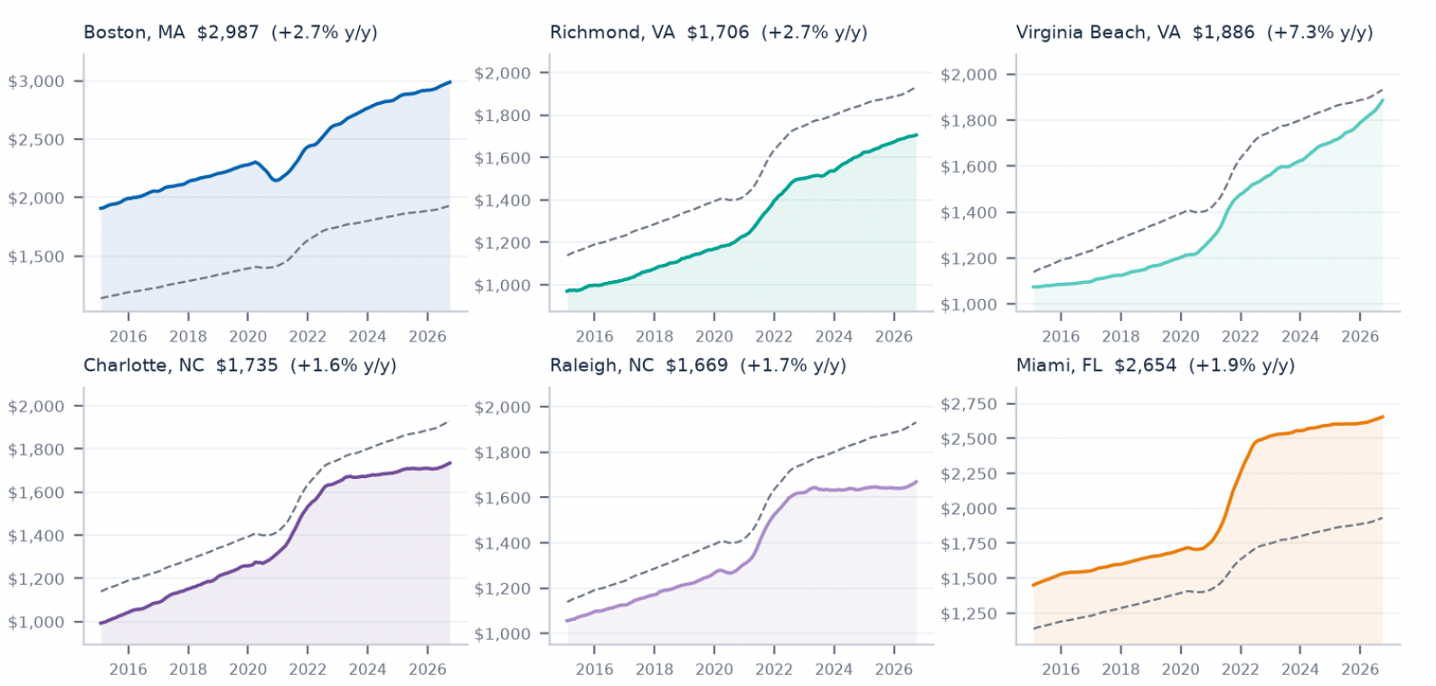
What about the real economy? Aren’t rising interest rates crashing the real estate market. In the US housing section we review the Zillow data.
Overall, the picture is stable. Some markets doing OK, like LA and Boston (strangely), but some a bit weak, like Florida and Austin.


Lots of horror stories on X about multi-family rents crashing, but the Zillow data says rents are still rising 1-2%/year.
But housing isn’t what you’re really worried about.
It’s not the reason the AI stocks are crashing.
Investors are worried OpenAI and Anthropic aren’t profitable, can’t pay for their 1GW datacenter lease obligations in 2028 and everything downstream from chips, to photonics to gas turbines will come to a complete stop.
Will Anthropic and OpenAI have the money to pay Coreweave and Oracle when the data centers are completed? Will underlying corporate AI spend grow enough over the next 2 years to cover the all the revenue purchase obligations these frontier models signed up for? Does it work out or did they massively overestimate everything?
Here the section in the presentation with charts from Ramp AI are useful. Ramp AI is business accounting software which gives them access to company level AI spending data which they roll up and anonymise.
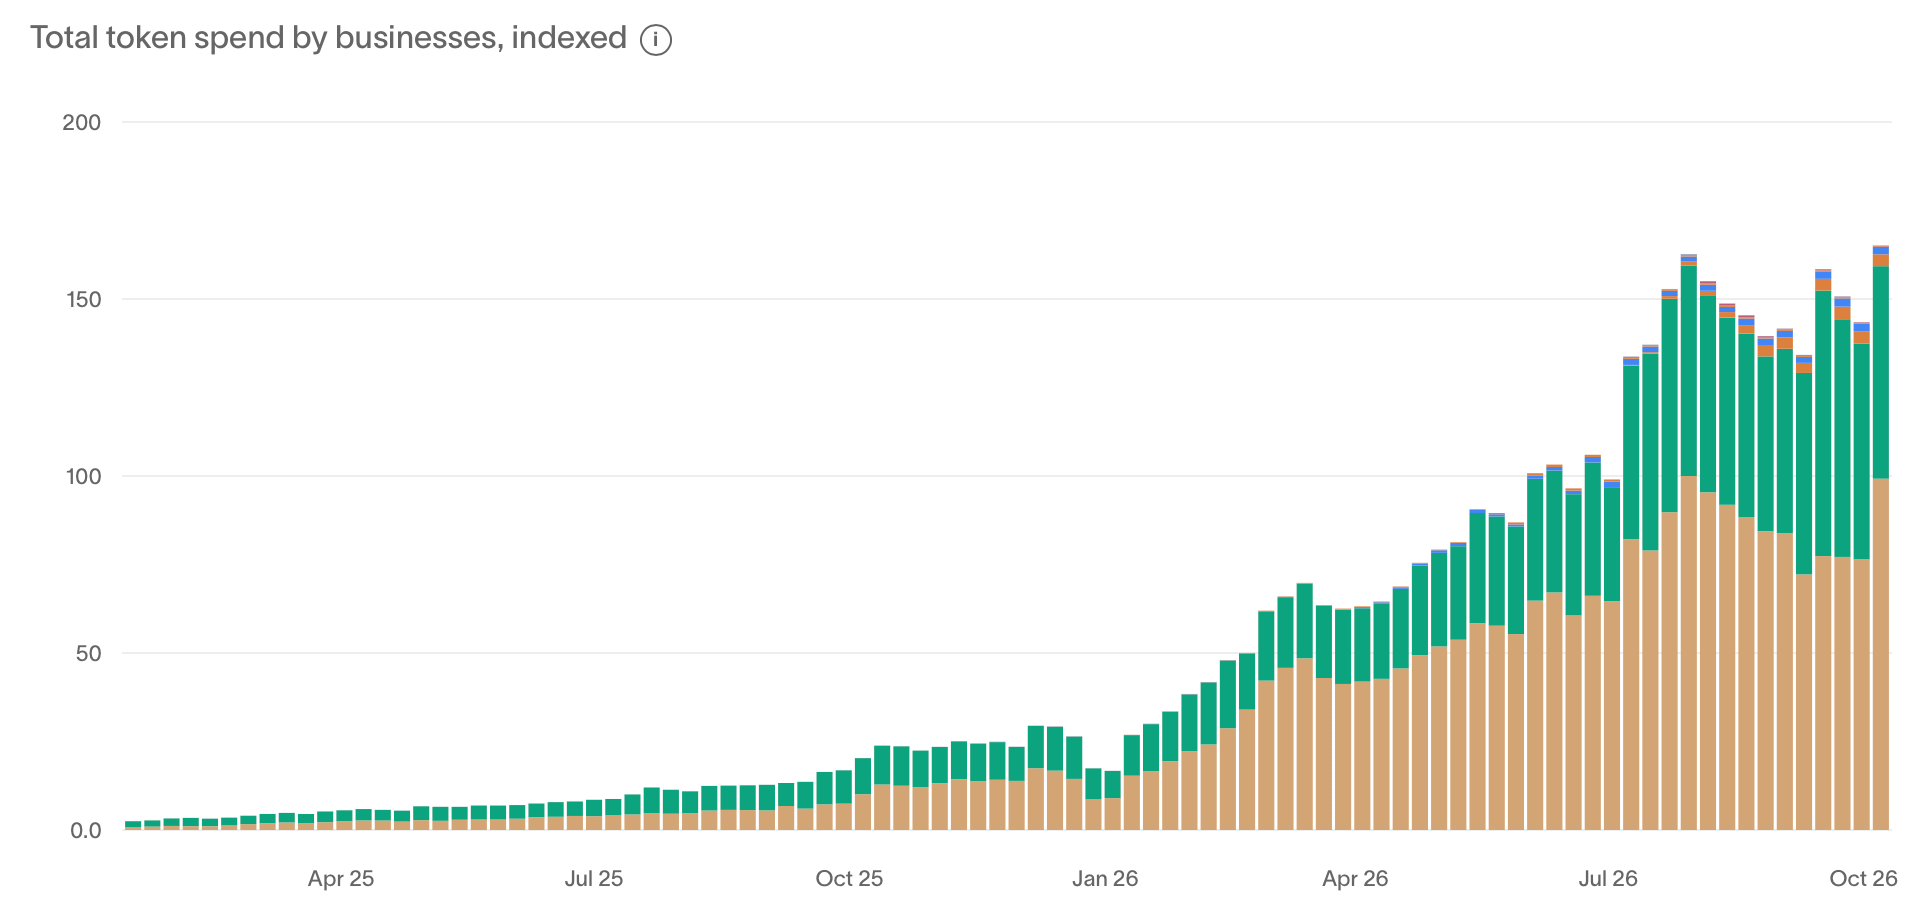
Below is the key chart which worries people.
Token spend flatlined over the last 3 months. Token volumes are still making new highs, but spend is flat because token prices have fallen.
Average token prices fell from $1.30 on average to 60 cts starting July. This lurch lower stalled out revenue growth and is causing panic in the market. A broader trend since April 2025 has been Anthropic coming down to match OpenAI pricing.
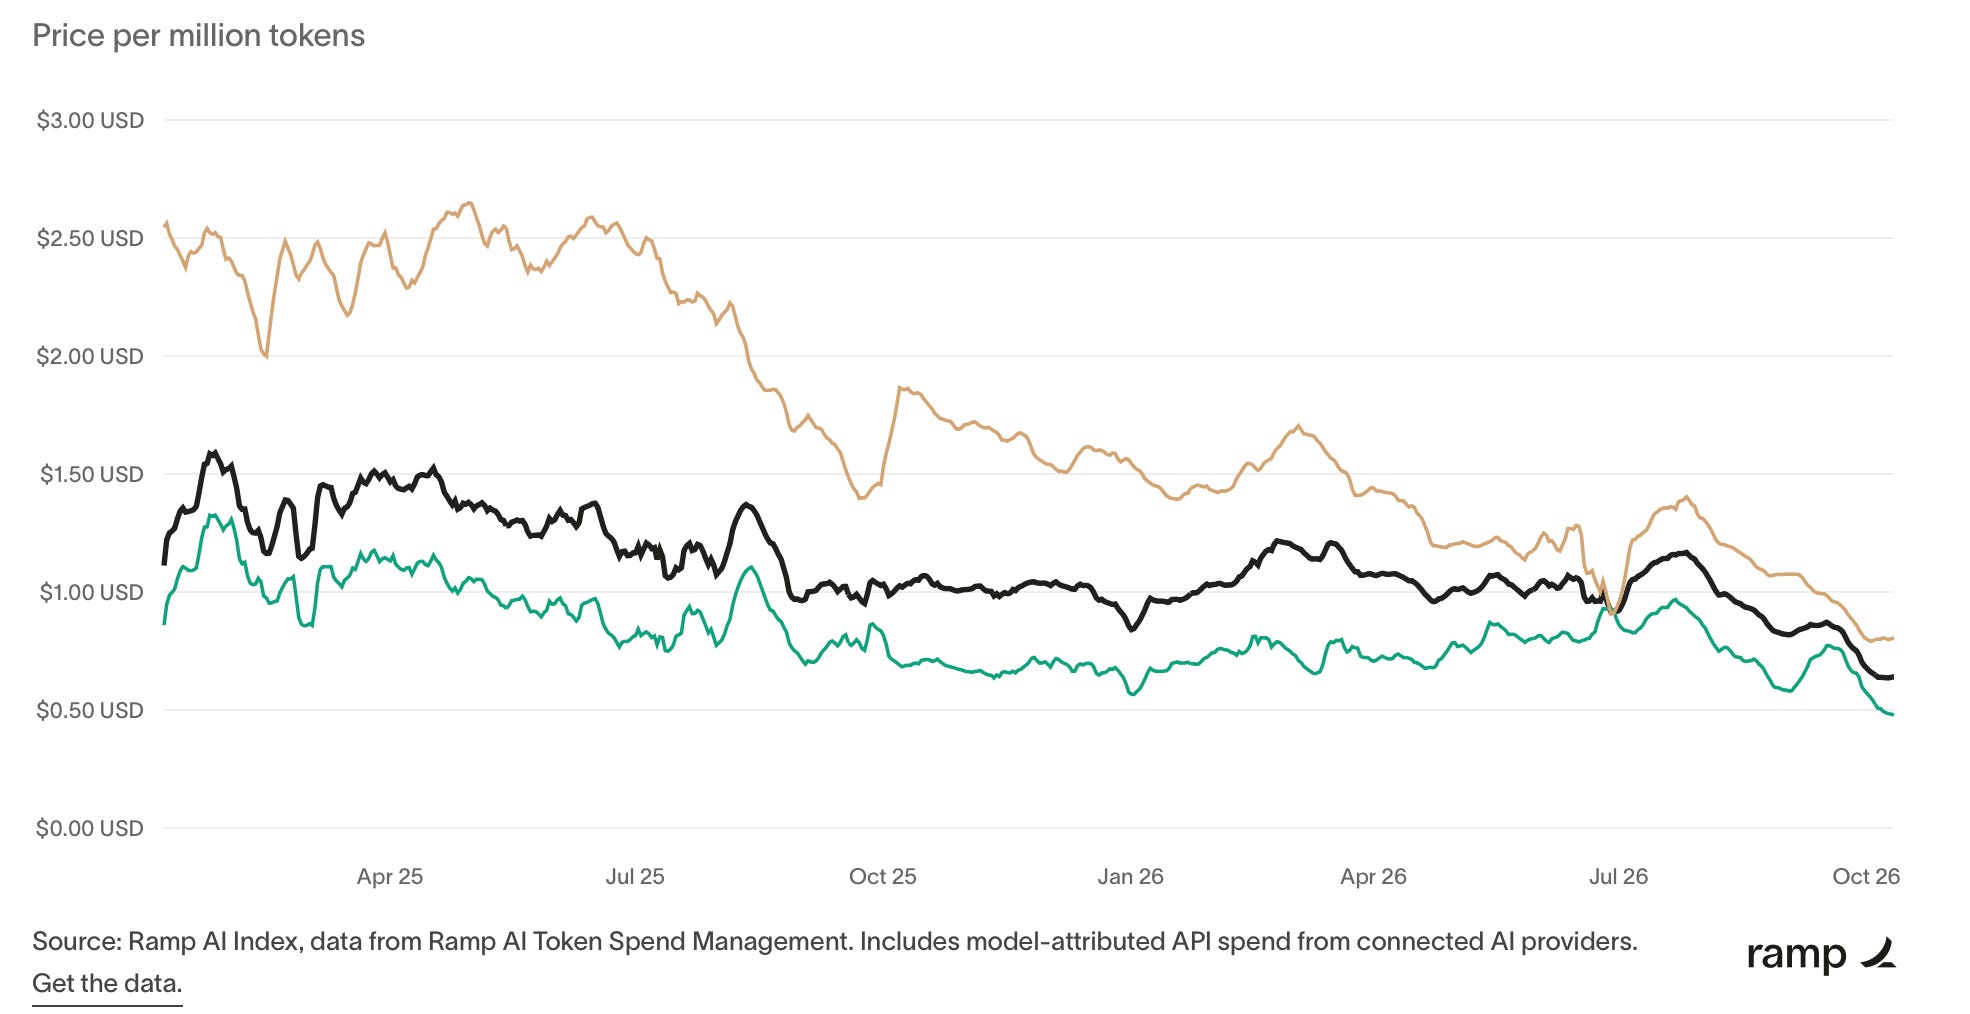
Where does token pricing go from here?
My prediction is price moves will be more gradual from here.
The stress we are seeing in credit markets are a signal to OpenAI and Anthropic that investors care less about usage growth and want to see more revenue growth. OpenAI and Anthropic will get the message. They don’t need to have a price war right before their IPO’s and when they have looming lease obligations. They are a duopoly. They can call a truce. For all the talk of Chinese models Deep Seek and Moonshot’s share of business spend is 0.3%.
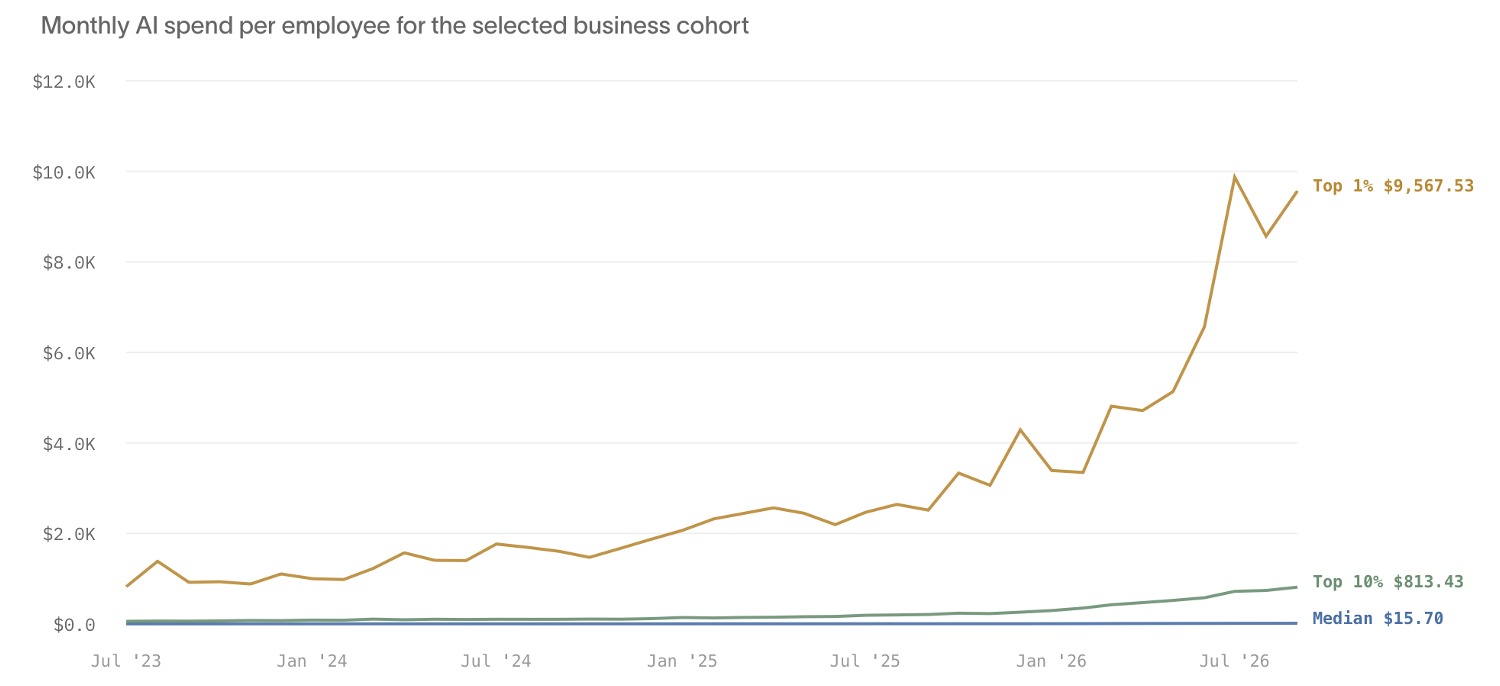
It has made sense up to this point to keep the models cheap and grow the user base. It has worked. 56% of US firms use AI. Now is the time to stabilise pricing and increase the spend per employee, which has a lot of room to grow.
The median spend per employee is $15/month. Back in January that was $6. Firms in the top 10% are spending $813/month/employee.
We all see what AI can do. We see how useful it is. We see how it cranks out documents, presentations and spreadsheets. Can you even go back to the old days anymore? I can’t.
When you look at what you do with AI all day, and how productive it makes you, couldn’t it be worth $100/month to a company? VC’s think it’s worth $10,000/month/employee.
And yet the median spend is $15/month/employee. That looks really low for something this important. In fact there is probably something wrong with your firm if you are only spending $15/month/employee.
Another great chart. Guess how much companies are spending on AI as a % of overall expenses?
5.7%! 5.7% on super intelligence. Crikey. Companies are spending more cleaning the bathrooms than they are on AI. There is so much headroom to raise these numbers.
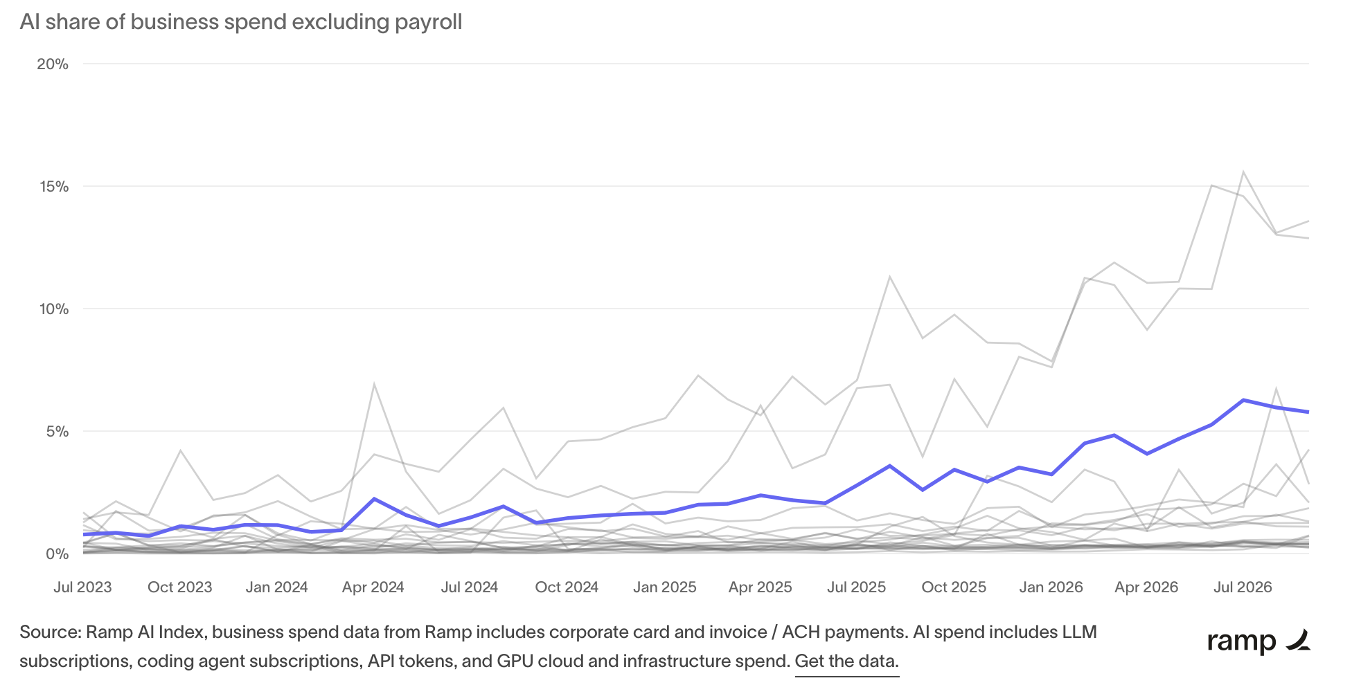
So it makes sense that corporate AI spend can grow dramatically from here.
Let’s put our health check together.
Corporate earnings are strong and growing.
S&P 500 valuations at the index level are back to below average.
Housing looks sleepy, but basically fine.
AI spend had 3 flat months and everyone is panicking.
But AI spend is super low amongst companies and can grow 10x without much imagination.
It’s hard to say companies are spending too much on AI. In fact it looks the opposite.
So the health check seems encouraging.
But what about the market?
Can we get a rally into year end?
Or do we crash lower?
And this is where we get the two key charts which indicate which way this is likely to go.
