YWR: Killer Charts
Disclosure: Personal views not investment recommendations.
Let’s look at some real estate charts. Thinking about the Taylor Rule lead me to think about everyone’s favorite asset class, residential real estate.
Economist John Taylor had 2 points for central banking.
First, financial forecasting was too difficult and so central bankers should be rules based. He even created his own rule, the Taylor Rule.
Second, that if there was is recession, and inflation is above the target rate (2%), then the Federal Funds rate needs to be above the inflation rate. If the Federal Funds rate is below the inflation rate, then monetary policy is not restrictive enough and won’t achieve the target.
The Atlanta Fed website has a built a Taylor Rule calculation. They’ve complicated the original rule, but the results are still shocking. The Taylor Rules says the Fed needs to raise rates further to 6%. The Fed’s view is if we are patient inflation will come down. Taylor would reply, but if you don’t raise rates high enough, inflation doesn’t come down.
Combine the possibility of a 6% Fed Funds rate with the move we’ve had in US housing. Over the last 5 years nationwide house prices are +63%, which exceeds the +50% move from 2002-2007.
New home starts in the US are up, but not extreme, especially given the growth in the population.
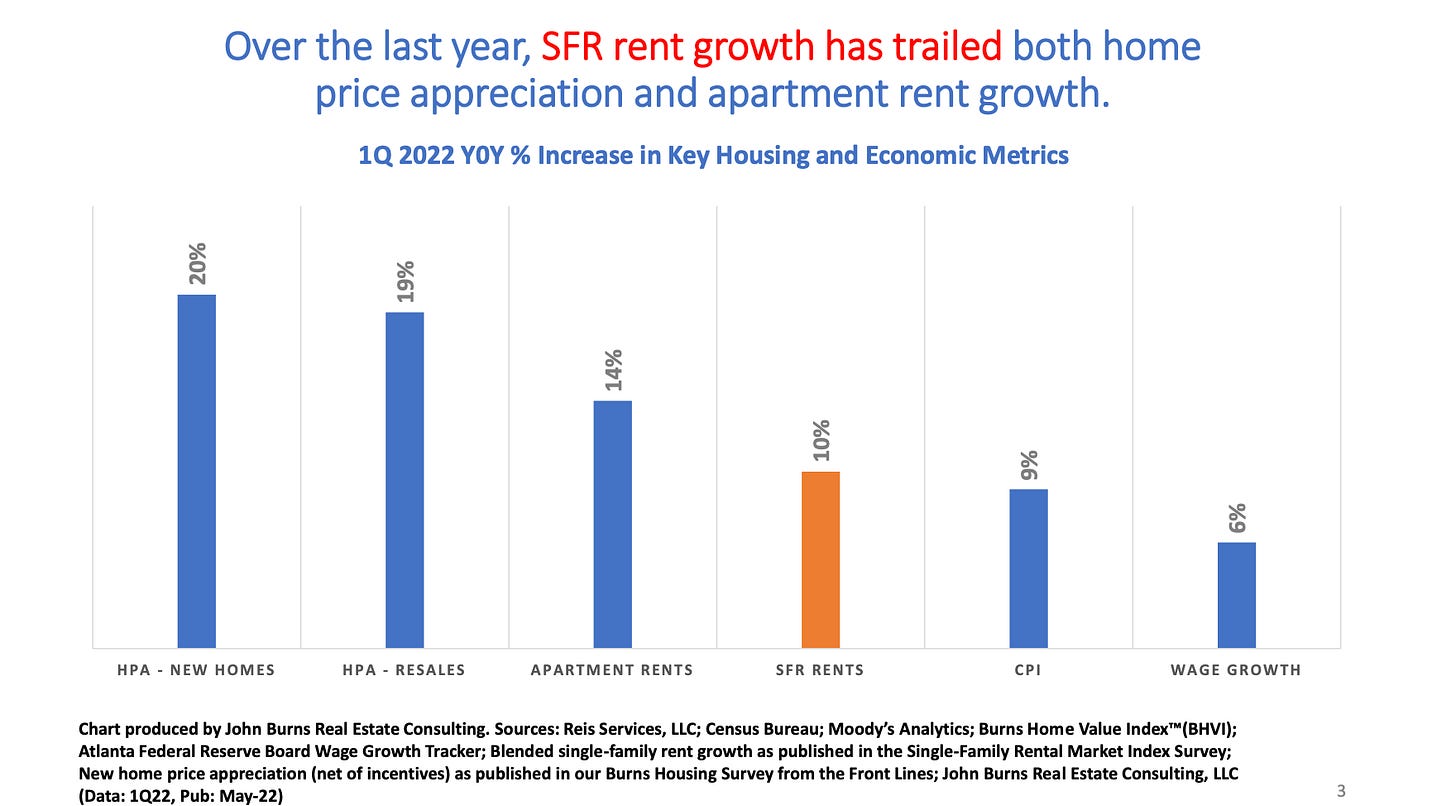
This is just my wild imagination but could this give rise to a situation where rents are rising, which contributes to inflation and higher interest rates, which is bad for house prices? Rents up but house prices down? Yes, higher rents increase the value of a property, but the rental market is not the main driver of single family home prices.
In hindsight did house prices benefit from a weak rental market, which kept inflation low and interest rates at zero?
Rental unit supply has lagged the owner occupied home supply. Over the last 5 years 908,000 new rental units were built compared to 7.4 million new owner occupied houses. Could this keep the rental market tighter than expected?


