YWR: Your Weekend Reading

YWR: Your Weekend Reading

Share this post

YWR: Your Weekend Reading
YWR: Killer Charts
Copy link
Facebook
Email
Notes
More

YWR: Killer Charts

Erik's avatar
Erik
Sep 24, 2024
∙ Paid
25

Share this post

YWR: Your Weekend Reading
YWR: Killer Charts
Copy link
Facebook
Email
Notes
More
1
Share

It’s that time of the month to flick through interesting charts.

I put together a 48 slide YWR Killer Charts deck for you with charts from:

  • BofA Fund Manager Survey,

  • S&P 500 Earnings Trends

  • Gold

  • Shipping

The link to the full chart presentation is at the bottom.

Here are 7 good ones for you starting with the BofA Fund Manager survey

  1. Record China bearishness. Just as Chinese stocks are inflecting upwards it’s reassuring to see record negativity towards the economy. China is on of our big themes (The #1 Trade).

Another good fund manager chart in the deck is that shorting Chinese stocks is a top idea.

  1. No interest in EM. Despite the Fed cutting rates nobody wants to play it through EM. This is another of our big themes (Go time for EM)

Other highlights from the BofA charts:

  • Investors are overweight cyclicals vs defensives.

  • Investor underweight in commodities

  • Investor underweight tech vs banks.

  • Nobody thinks inflation will rise or wants to own commodities despite Fed cutting rates when the economy is strong.

  1. Investors refuse to get ‘sucked in’ to buying gold. Another theme we like is gold and it’s good to see that despite the record gold ETF flows who retail investors refuse to get ‘sucked in’. This has never happened before, which means this could be ‘the big one’.

  1. The real risk free asset. Consistent central bank buying is the new trend and why gold is trading so well. Central Banks are switching into gold as fast as they can.

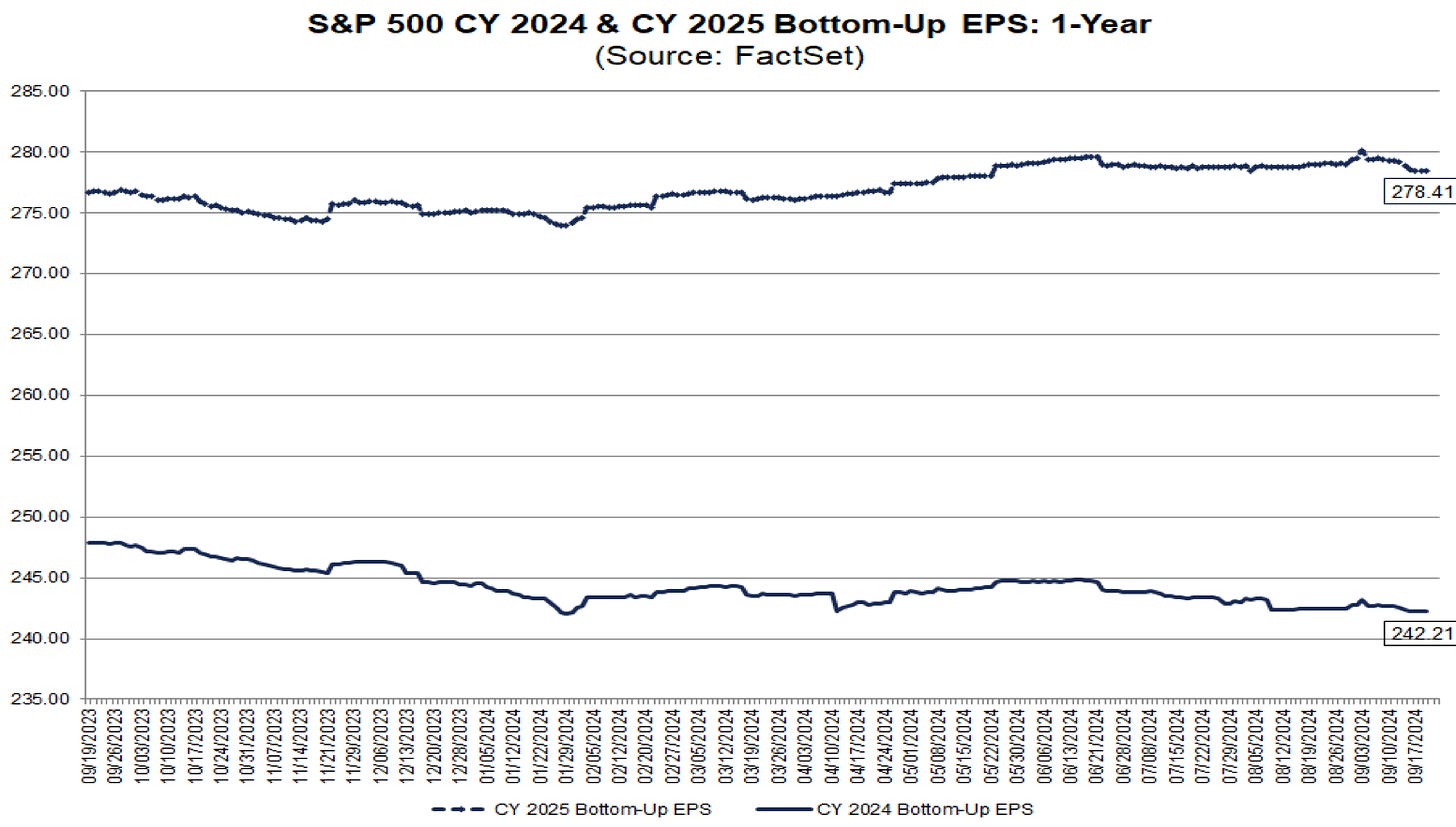
  1. Where is the recession? 2024 and 2025 EPS estimates for the S&P 500 are stable and at record highs with 15% growth projected. Why are we cutting rates again?

국 
미 
0 
c 
2 
4 
0 
0%9i2023 
0년26i2023 
1면03i2023 
1멸1이2023 
1멸17i2023 
1미24仁023 
1멸31i2023 
11i07i2023 
11서4i2023 
11!21i2023 
11i29i2023 
1106!2023 
1113!2023 
1120!2023 
1128!2023 
01!05i2024 
01서2i2024 
01!22i2024 
01!29i2024 
02t05i2024 
02녀2i2024 
이20!2024 
이27!2024 
이05!2024 
0韲2!2024 
03녀9i2024 
이26!2024 
04t03i2024 
04녀이2024 
04t17i2024 
04t24i2024 
0원01i2024 
0원08i2024 
0구5i2024 
0원2기2024 
0원3이2024 
0턴06i2024 
06녀3i2024 
0턴21i2024 
0턴2엷2024 
07!0턴2024 
07서5i2024 
07!2기2024 
07!29i2024 
0민05i2024 
0일1기2024 
0일19i2024 
0민26i2024 
0몋03i2024 
0멸1이2024 
0희17i2024 
0 
3
  1. The Stealth rally in offshore day rates. No one is paying attention to stocks like Valaris and Saipem, but day rates are crossing $500k again.

Clarksons Offshore Dayrate Index (AHTS, floaters and subsea 
130 
120 
110 
100 
90 
80 
70 
60 
50 
40 
so 
o 
c 
o 
Offshore boom 
ended by the Global 
Financial Crisis 
Fiscal stimulus ensures 2009 
downturn in offshore is 
relatively brief 
Saudi induced price war for 
market share with US shale 
begins a prolonged downturn 
for offshore vessel markets 
Supply-side rebalancing 
has met improved 
demand in all the major 
offshore vessel markets 
and boosted dayrates to 
new highs 
Covid- 19 ends 
small-scale 
improvements 
seen in 2019 
o 
c 
o 
00 
o 
c 
o 
o 
c 
o 
c 
o 
c 
o 
c 
o 
c 
o 
c 
o 
c 
o 
•o 
c 
o 
c 
o 
CO 
c 
o 
c 
o 
c 
o 
c 
o 
c 
o 
c 
o 
c 
Fleet-size weighted index of dayrates across AHTS, PSVs, Jack-up drilling units, floating drilling units and subsea MSVs. 
Source: Clarksons Research
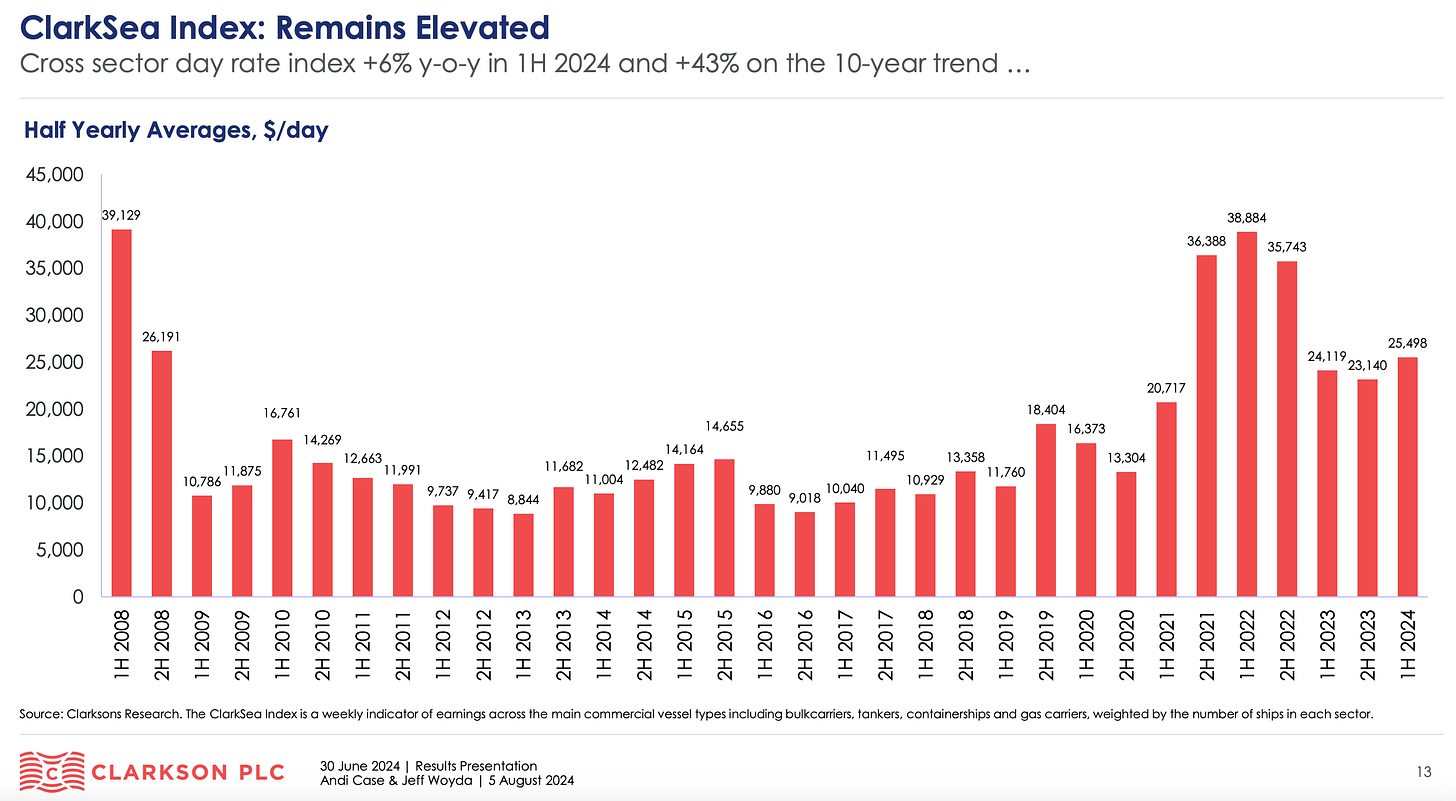
  1. The Stealth Rally in Shipping. Day rates are surprisingly strong across several different shipping sectors. The latest YWR Global Factor Model has also been throwing up a lot of shipping names. It’s a trend nobody is talking about.

O 
O 
O 
O 
O 
O 
0 
0 
Z 
0 
0 
0 
4 
금 
(0 
흐 
0 
0 
혘 
0 
0 
0 
(8 
0 
(Q 
0 
1 
0 
0 
IH 2008 
2H 2008 
IH 2009 
2H 2009 
IH 2010 
2H 2010 
1H2011 
2H 2011 
IH 2012 
2H 2012 
IH 2013 
2H 2013 
IH 2014 
2H 2014 
IH 2015 
2H 2015 
IH 2016 
2H 2016 
IH 2017 
2H 2017 
IH 2018 
2H 2018 
IH 2019 
2H 2019 
IH 2020 
2H 2020 
IH 2021 
2H 2021 
IH 2022 
2H 2022 
IH 2023 
2H 2023 
IH 2024 
0 
0 
0 
0

The rest of the shipping charts include:

  • why the Red Sea is bullish for containerships

  • The aging shipping fleet

  • The reduced global shipyard capacity

  • surprising strength in Chinese imports

  • the current shipping order book versus history

Below is a link to the full Killer Chart slide deck.

All presentations are also available in the YWR Library (www.ywr.world).

This post is for paid subscribers

Already a paid subscriber? Sign in
© 2025 YWR
Privacy ∙ Terms ∙ Collection notice
Start writingGet the app
Substack is the home for great culture

Share

Copy link
Facebook
Email
Notes
More