

This month’s YWR chart pack confirms our bullish strategy.
But also reminds us of a challenge we are going to have to navigate in the near future.
We will discuss that at the end.
The chart pack is 54 slides covering:
S&P 500 Earnings Estimates
BofA Survey
University of Michigan Consumer Survey
10 year bond yields
A link to the full deck is at the bottom of the post.
I want to especially highlight the charts I included from the University of Michigan consumer survey because I found them shocking. Maybe consumers are just better at complaining these days, but the results are at historic lows despite full employment and a booming stock market. I found it surprising how extreme all the charts are right now.
It could be a big deal.
So get yourself a coffee and go over all the slides, but here are 8 highlights then slide 9 and my final takeaway.
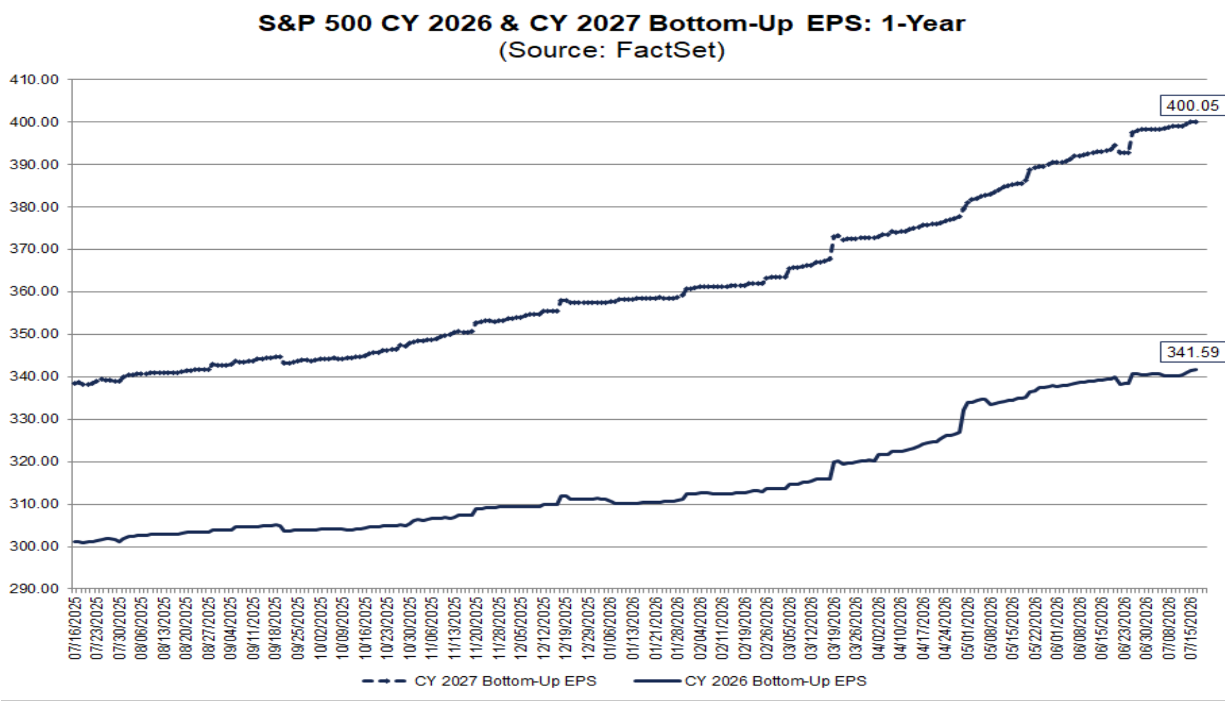
#1 We hit $400/share for the S&P 500 2027 EPS Estimate.
This is a key milestone for our S&P $10,000 target (S&P $10,000 Update). Estimates revisions remain positive.
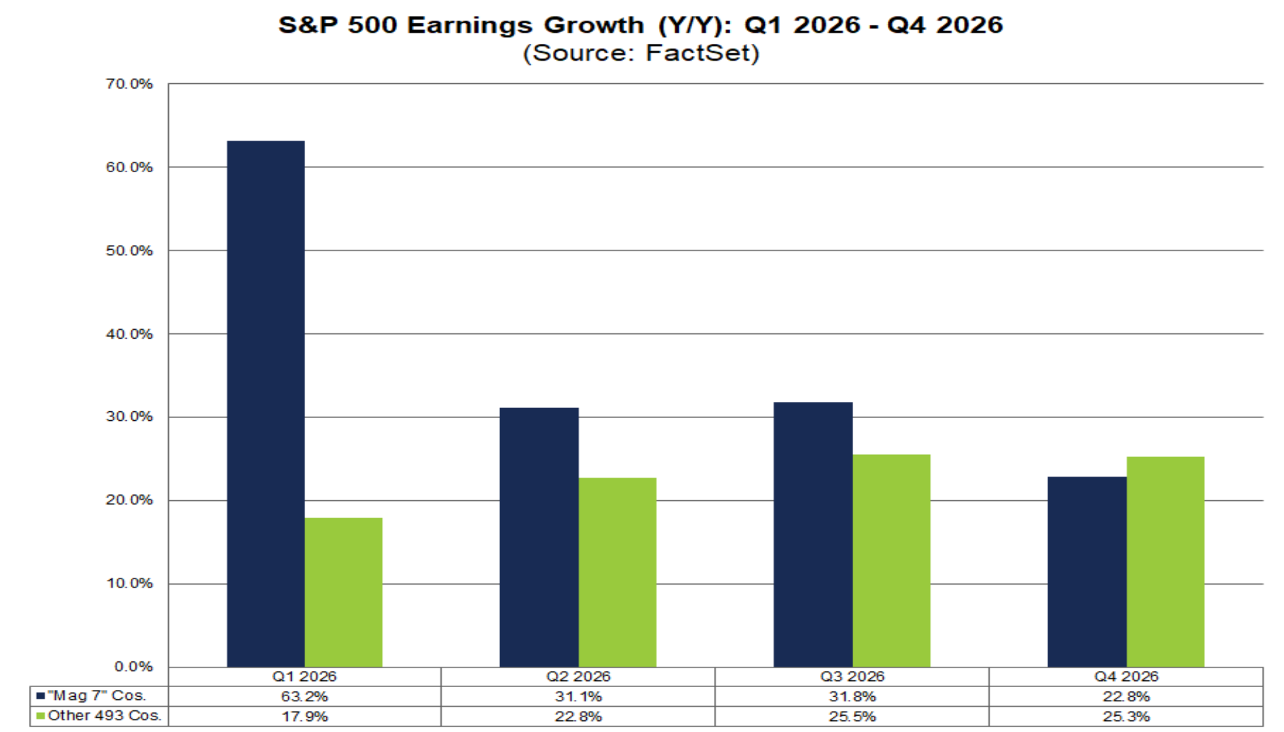
#2 The market is no longer a Mag7 story. The ‘Other 493’ are growing earnings 25%.
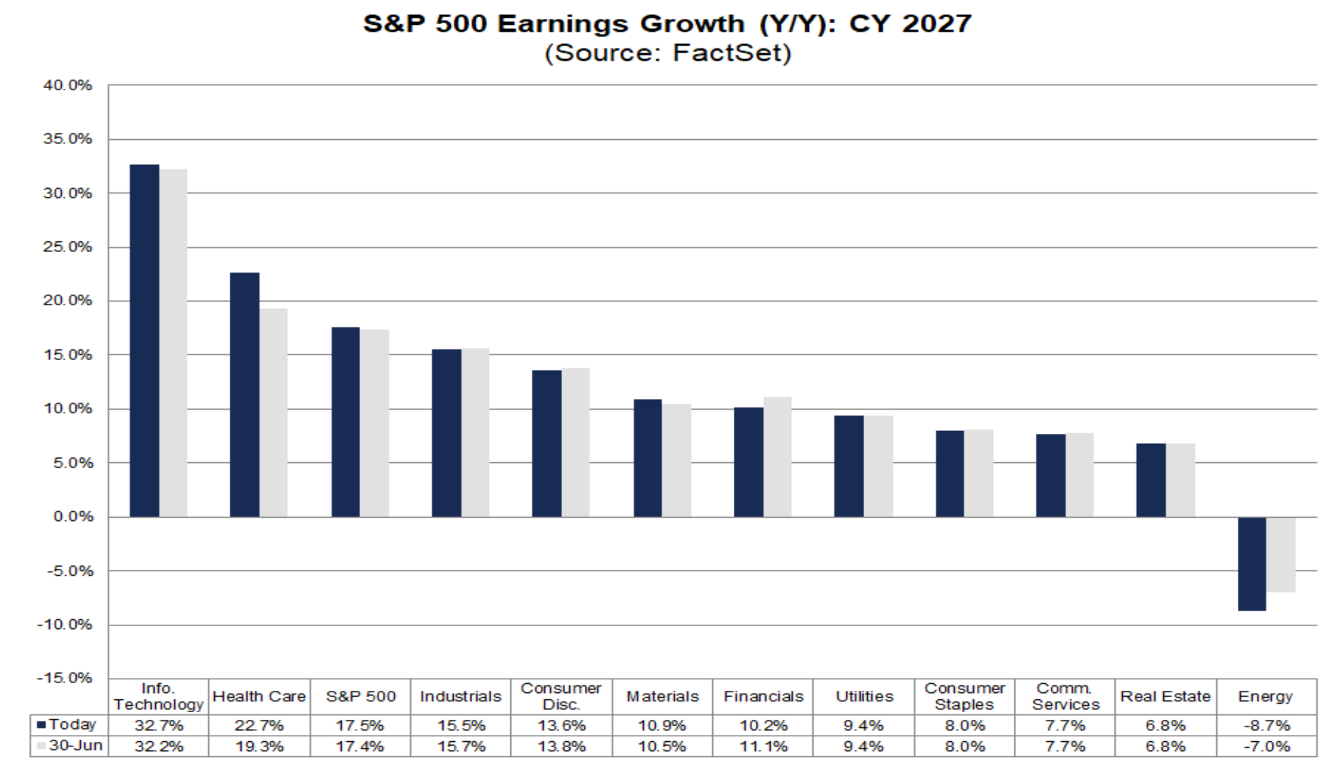
#3 S&P 500 EPS estimates for 2027 are 17% growth with the energy sector negative.
Expectations around energy look too bearish to me.
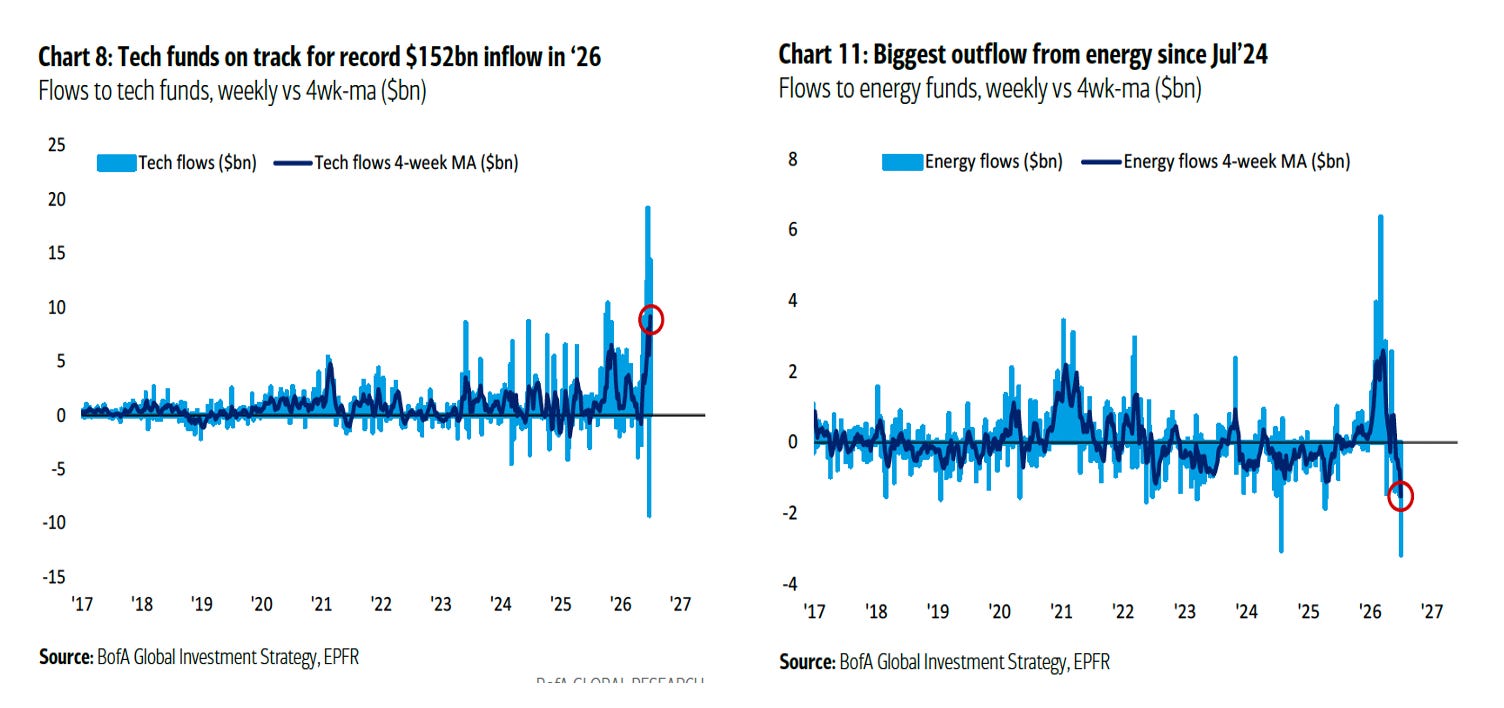
#4 Investors are piling into Tech and out of Energy.
Record inflows into tech funds and record outflows from energy as we go into a global energy crisis. Kind of amazing.
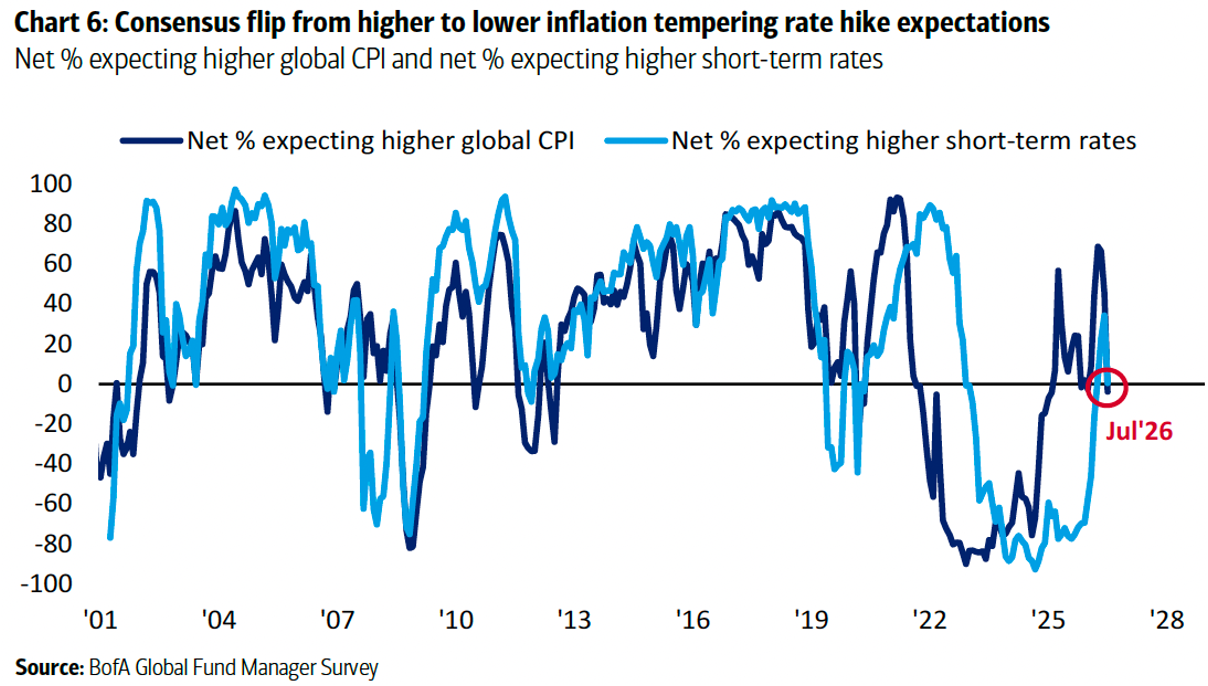
#5 Fund managers are sanguine about inflation and rate hikes.
CPI hits 4.2% and everyone is convinced it’s a 1-off and the Fed doesn’t need to do anything. According to the BofA fund manager survey 83% of fund managers expect no rate hikes before the midterm elections.
#6 Consumers have never felt worse.
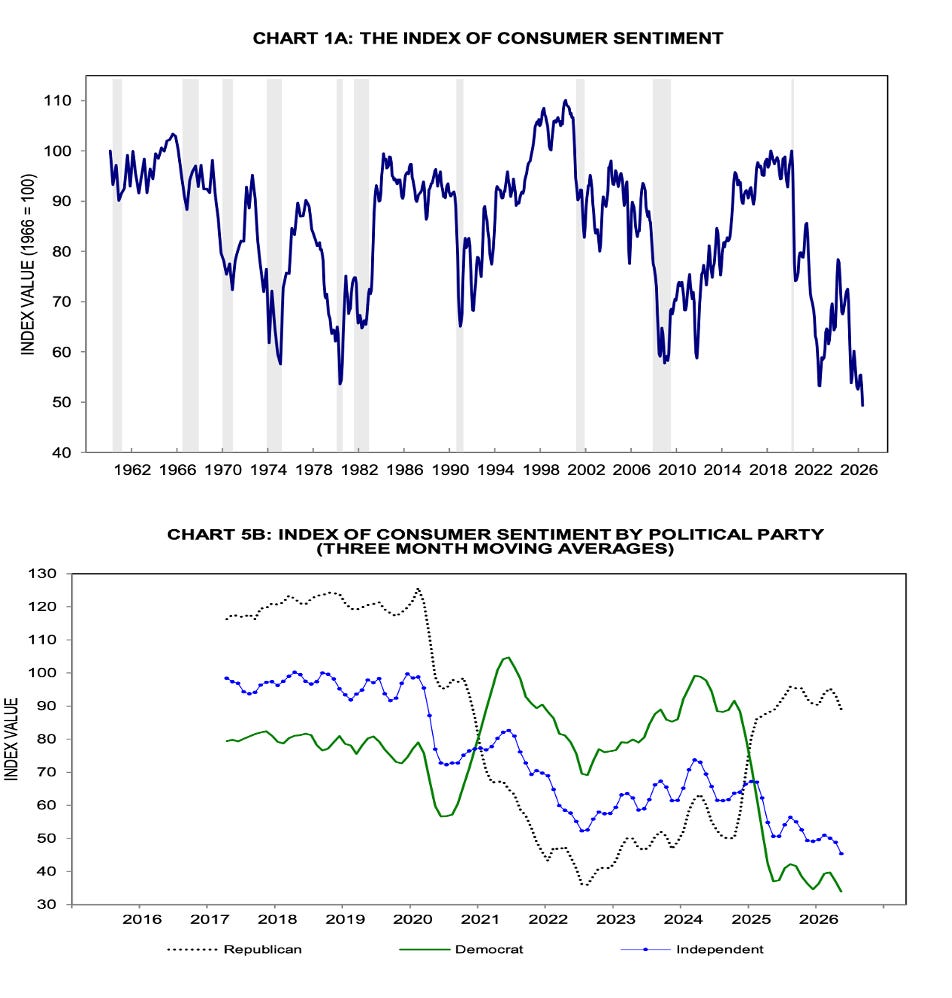
The market is making new highs, the economy is booming and unemployment is low, but the University of Michigan consumer survey readings are off the charts negative. Like lowest ever.
Within the readings there is an unprecedented polarisation in sentiment by political party.
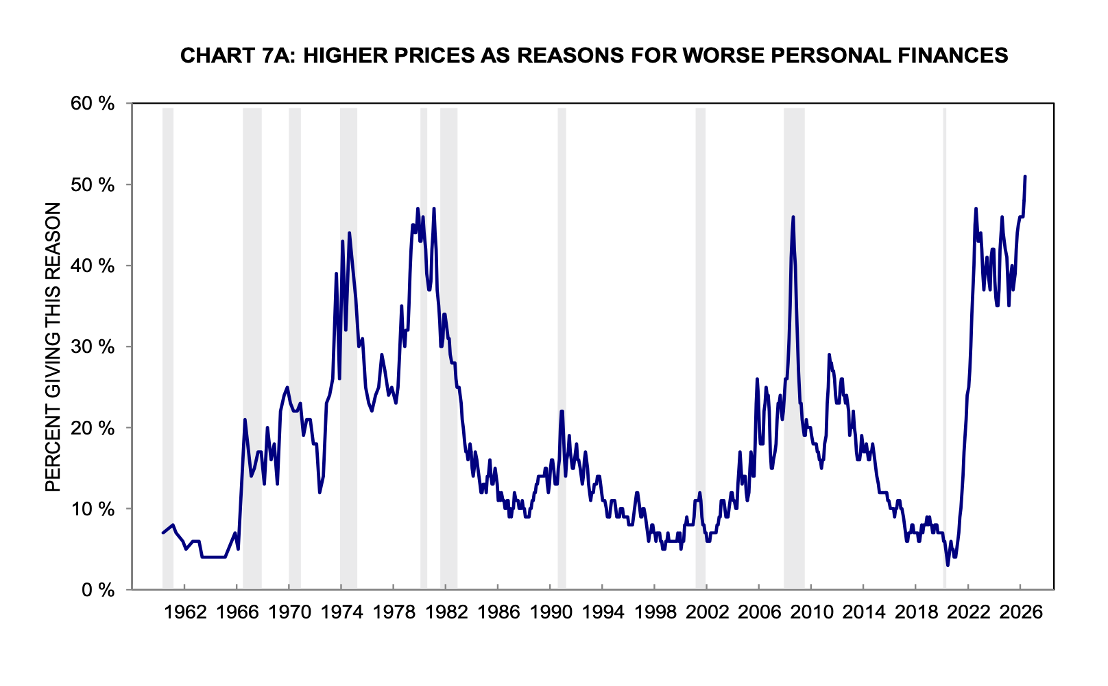
#7 Consumers are in pain over rising prices.
Inflation is only 4% but consumers are in extreme pain.
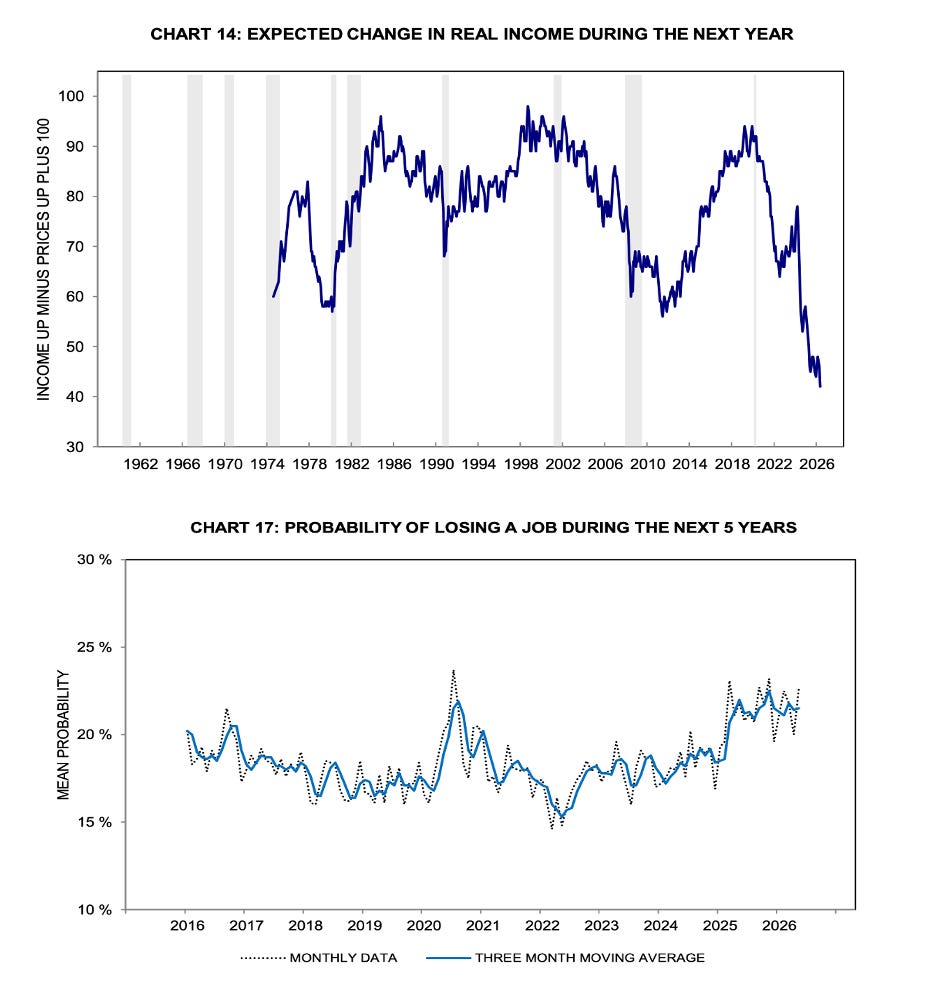
#8 Consumers are miserable and expect things to get worse.
The future expectations reading is making an all time record low, even lower than the financial crisis. Consumers are more negative about their future than they have ever been. This is profound.
There is a rising concern about future unemployment.
So what story do I see playing out here?
What is the challenge we need to face?
Here is the other most important chart from the University of Michigan Survey. Chart 9.
