YWR: Killer Charts
While the overall US banking system loan growth numbers look quite moderate, some of the smaller banks have been lending aggressively. Especially, in the last 3 years.
Look at the jump in Western Alliance’s loan book from 2019 to 2022. They are a small bank in Phoenix and go from $19bn to $50bn in 3 years, most of this in commercial real estate. Phoenix has been booming and Western Alliance along with it.
Banks like this which grew too quickly are now getting into trouble from the double whammy of changes in commercial real estate trends and higher funding costs.
There is a growing concern this could be a repeat of the Savings and Loans crisis of the 1980’s.
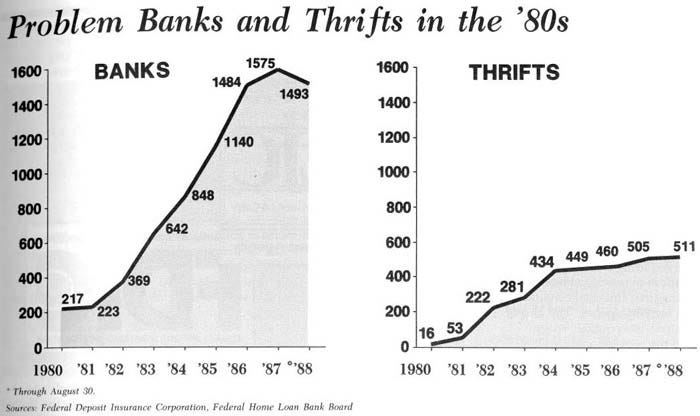
So let’s take a trip down memory lane and look at a few charts from the Savings and Loans crisis in the 1980’s.
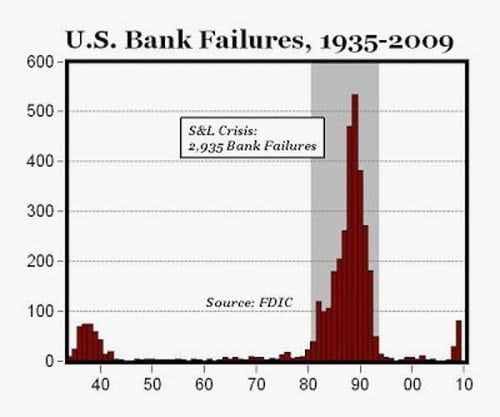
I was listening to Van Halen at the time, so I was too young to realize how long the crisis persisted and that 2,935 banks and thrifts would fail over 10 years. This is key to appreciate since our recent crises have resolved themselves quickly.
The Savings and Loans crises had two distinct periods, 1982 and 1989-1990. It went on for a decade.


