YWR: Killer Charts
It caught my eye when I saw Nvidia’s market cap was over $1 trillion.
I didn't realise it had become that big.
Which brings us to the the point of this week’s Killer Charts; appreciating the size and scale of US capital markets.
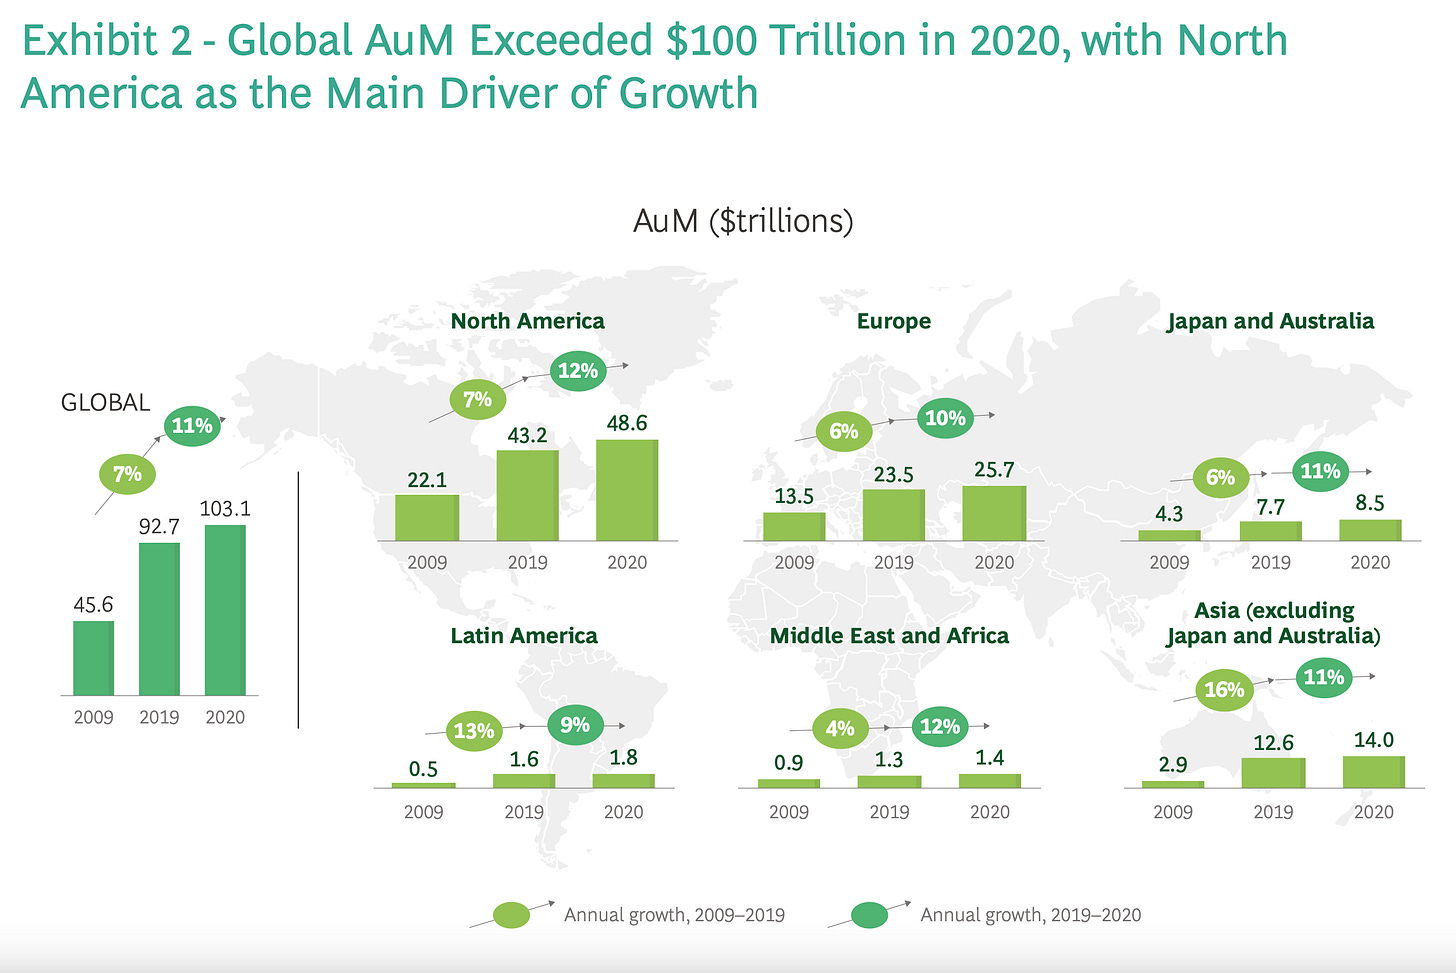
Sometimes we don’t realise how much the US is pulling away in terms of market size and funds under management.
It’s understandable that for US investors it’s becoming easy to not pay attention to the rest of the world.
Look at the table below from the SIFMA Capital Markets Factbook.
In 2007 the US market cap was $19 trn, while Europe was $11.8 trn and the UK was $3.8 trn.
Europe and the UK together were almost the same size as the US.
To a US investor Europe + UK would have seemed like important markets.
Fast forward to the 2021 data.
The US market is $52 trillion. The UK is still $3.8 trillion and Europe is a bit bigger at $13.8 trillion.
I guess Europe still matters, but the UK kind of doesn’t.
The UK is becoming kind of like…. Canada.


