YWR: Your Weekend Reading

YWR: Your Weekend Reading

Share this post

YWR: Your Weekend Reading
YWR: Killer Charts
Copy link
Facebook
Email
Notes
More

YWR: Killer Charts

Erik's avatar
Erik
Jan 23, 2024
∙ Paid
9

Share this post

YWR: Your Weekend Reading
YWR: Killer Charts
Copy link
Facebook
Email
Notes
More
1
Share

Disclosure: This is market commentary and personal views only. These are not investment recommendations. For that seek professional help.

Goldman Investor Survey

The year has barely started and yet everyone has already thrown in the towel on all sectors ex-tech. It’s consensus is that 2024 is a repeat of 2023. At a recent GS conference in London tech was the favourite sector for 2024 and almost half the room predicted Mag7 outperforms again. The worst is consumer.

Source: Goldman Sachs.

Everyone knows Mag7 has the best earnings growth and it continues through 2025.

Source: Goldman Sachs

Switching to US earnings.

Q4 2023 earnings have been missing, primarily in financials, but I don’t care much if this is Q4 kitchen sinking. I’m watching for if the outlook is changing for 2024.

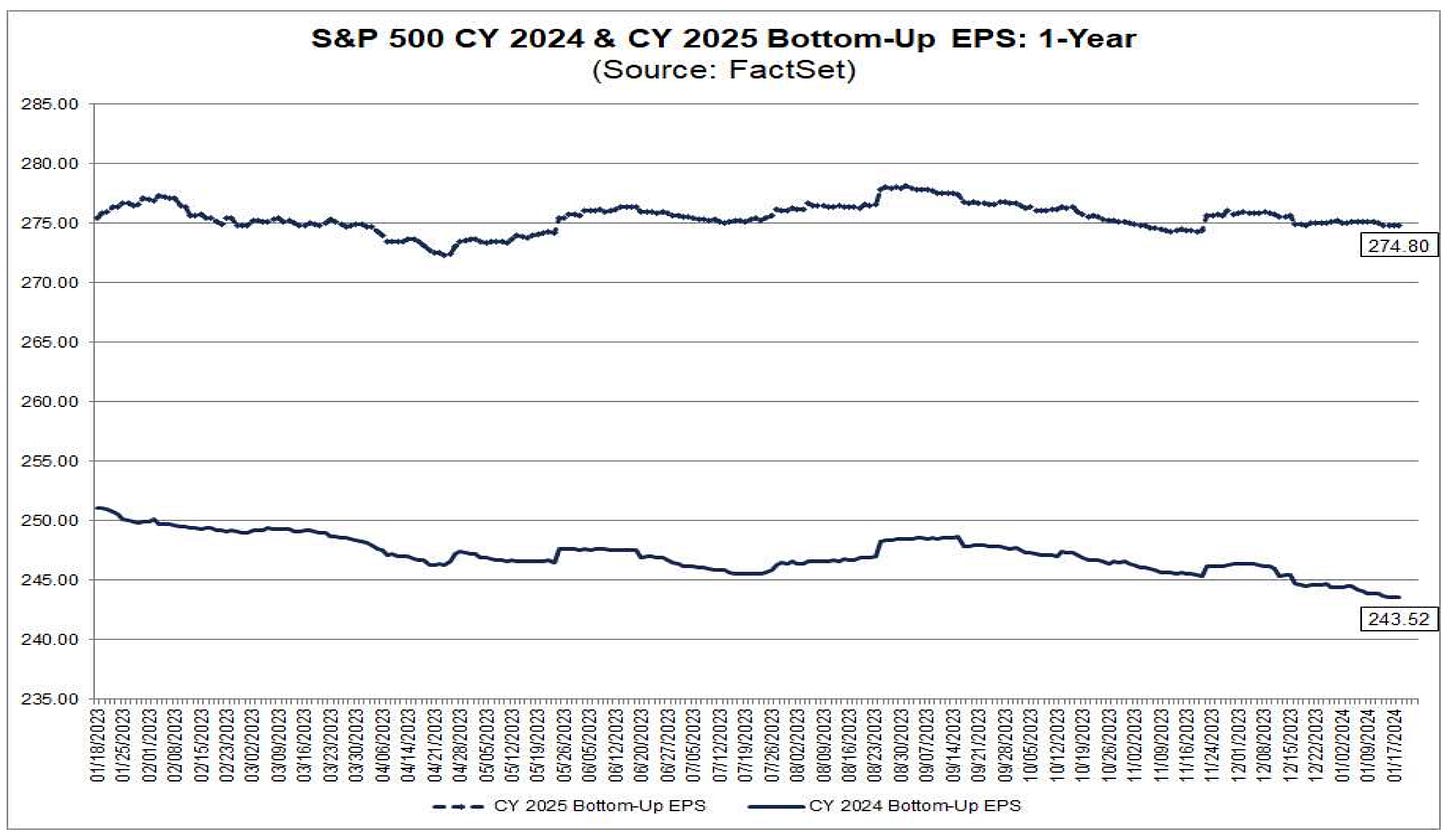
It’s a bit soggy, but forward estimates typically trend down slightly over time, so the 2024 trend isn’t alarming (yet).

8 
4 
국 
0 
0 
국 
0 
8 
01!賴2023 
01!25i2023 
0기01i2023 
0기0법2023 
02미5i2023 
02%!2023 
이0기2023 
이09/2023 
이16i2023 
이23仁023 
이30仁023 
04!0하2023 
04.너4i2023 
0421!2023 
04!제2023 
0원05i2023 
0N1기2023 
0구19i2023 
이%!2023 
0털05i2023 
0하1기2023 
0다2이2023 
0텐27i2023 
07!05i2023 
07!欞2023 
07!斟2023 
07!26i2023 
0텐02仁023 
이09!2023 
이1하2023 
이212023 
0일3이2023 
0희07i2023 
0이14i2023 
0희21i2023 
0희28i2023 
1미05i2023 
1미1기2023 
1미1이2023 
1126!2023 
11!0기2023 
11!0희2023 
11!1하2023 
11!24!2023 
1101!2023 
1기08仁023 
1기15i2023 
1기2기2023 
01!0기2024 
01!09i2024 
01너7!2024 
8 
8 
8 
8 
8 
8 
8 
8 
8 
0 
3 
『고

Earnings season is still early but here are the notable revisions. Three travel related stocks. 2 asset managers. I like the airlines, just wish they paid dividends.

QI 2024: EPS Revisions 
Upward Change in QI EPS (Trailing 4 Weeks): 
(Source: FactSet) 
Top 10 S&P 500 cos. 
Live Nation Entertainment. Inc 
Expedia Group, Inc. 
American Airines Group Inc. 
Westem Digital 
Incyte Corporatim 
Southwest Airlines Co. 
Stanley Black & Decker, Inc. 
T. Rowe Price Group 
Hmtinqon Ingans Industries, Inc 
Invesco Ltd 
0% 
30.5% 
15.4% 
12.2% 
11.9% 
10.9% 
10.8% 
10.7% 
10.5% 
50% 
94.6% 
100% 
150% 
200% 
250% 
300% 
327.5% 
350%
Downward 
Coterra Enerw Inc. 
EQT Corporäion 
M ardhon Oil Corporäion 
Illumna Inc. 
Albemarle Corporation 
Urited Airines Holdngs, Inc. 
APA Corporation 
Vertas, Inc. 
Occidental Petroleum Corpordion 
Pimacle West Capital Corporation 
-51.0% 
Change in QI EPS (Trailing 4-Weeks): 
(Source: FactSet) 
Top 10 S&P 500 cos. 
-350% 
-300% 
-250% 
-200% 
-150% 
-100% 
-15.4% 
-16.7% 
-17.0% 
-17.6% 
-18.4% 
-20.6% 
-20.6% 
-25.0% 
-27.6% 
-50% 
0%

That $240/share number needs to hold and not drop to $220. Otherwise, there is a picture forming that the S&P 500 may have gone ex-growth at the index level.

S&P 500 Calendar Year Bottom-Up EPS Actuals & Estimates 
(Source: FactSet) 
300.00 
275.00 
250.00 
225.00 
200.00 
175.00 
150.00 
125.00 
100.00 
7500 
50.00 
2500 
0.00 
119.12 
CY2014 
118.82 
CY2015 
119.40 
CY2016 
133.61 
CY2017 
161.56 
CY2018 
163.13 
CY2019 
140.46 
CY2020 
208.49 
CY2021 
219.19 
CY2022 
217.64 
CY2023 
243.52 
CY2024 
274.80 
CY2025

All these massive swings (2021 +, 2022 -, 2023 +), but trailing 12 month EPS has gone flat. It might just be a temporary pause.

(가 
88888888888888888888888888 
01서7i2014 
이27!2014 
0다04i2014 
0鬧1!2014 
1먫1하2014 
12%!2014 
이04i2015 
0구11i2015 
07!忉2015 
0희23!2015 
11!3이2015 
02t0하2016 
04녀5i2016 
0하2기2016 
이29!2016 
11!03i2016 
01!欞2017 
이22!2017 
0구3이2017 
0민04i2017 
1먠11i2017 
12t1하2017 
02t27i2018 
0구04!2018 
07서기2018 
0희1하2018 
11!23i2018 
02t04i2019 
04너1i2019 
0하19i2019 
0민26i2019 
1미31i2019 
01!09i2020 
이帽i2020 
0구26i2020 
07!31i2020 
1앤07i2020 
1기14i2020 
02t23!2021 
04!3이2021 
07!0하2021 
0희14i2021 
11!%i2021 
01!27i2022 
04.t05i2022 
0텐13i2022 
이19i2022 
1미2하2022 
01!04i2023 
0협4i2023 
0艪9i2023 
07!2법2023 
1얜04!2023 
1기11i2023 
0占졍呂들뵐g결띜8§경§§경§§§§§§쇵舅邑冒冒 
888888888 
8888888888888888 
0

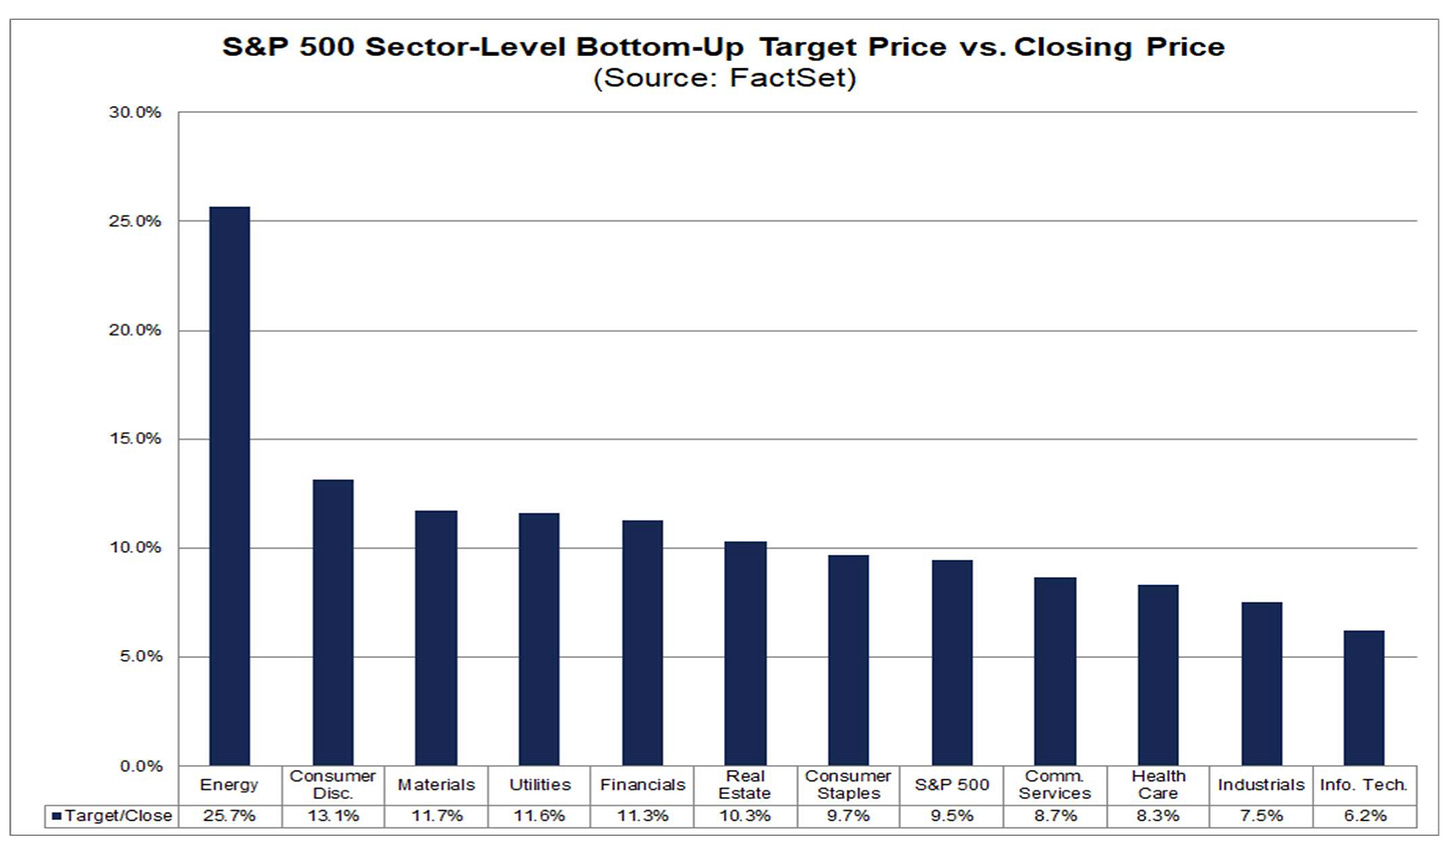
Bottom up analyst price targets show the most upside in Energy. Second highest is Consumer (the least favourite sector in Goldman’s survey).

S&P 500 Sector-Level Bottom-Up Target Price vs. Closing 
(Source: FactSet) 
Price 
30.0% 
250% 
20.0% 
150% 
10.0% 
5.0% 
0.0% 
Target/CIose 
Energy 
25.7% 
Consumer 
Disc. 
131% 
M aterials 
11.7% 
Utiities 
11.6% 
Finalcids 
11.3% 
Estate 
10.3% 
Consumer 
Staples 
9.7% 
S&P 500 
9.5% 
Comm 
Services 
8.7% 
Health 
8.3% 
Industrials 
7.5% 
Info. Tech 
6.2%

Citibank, GM and Conoco

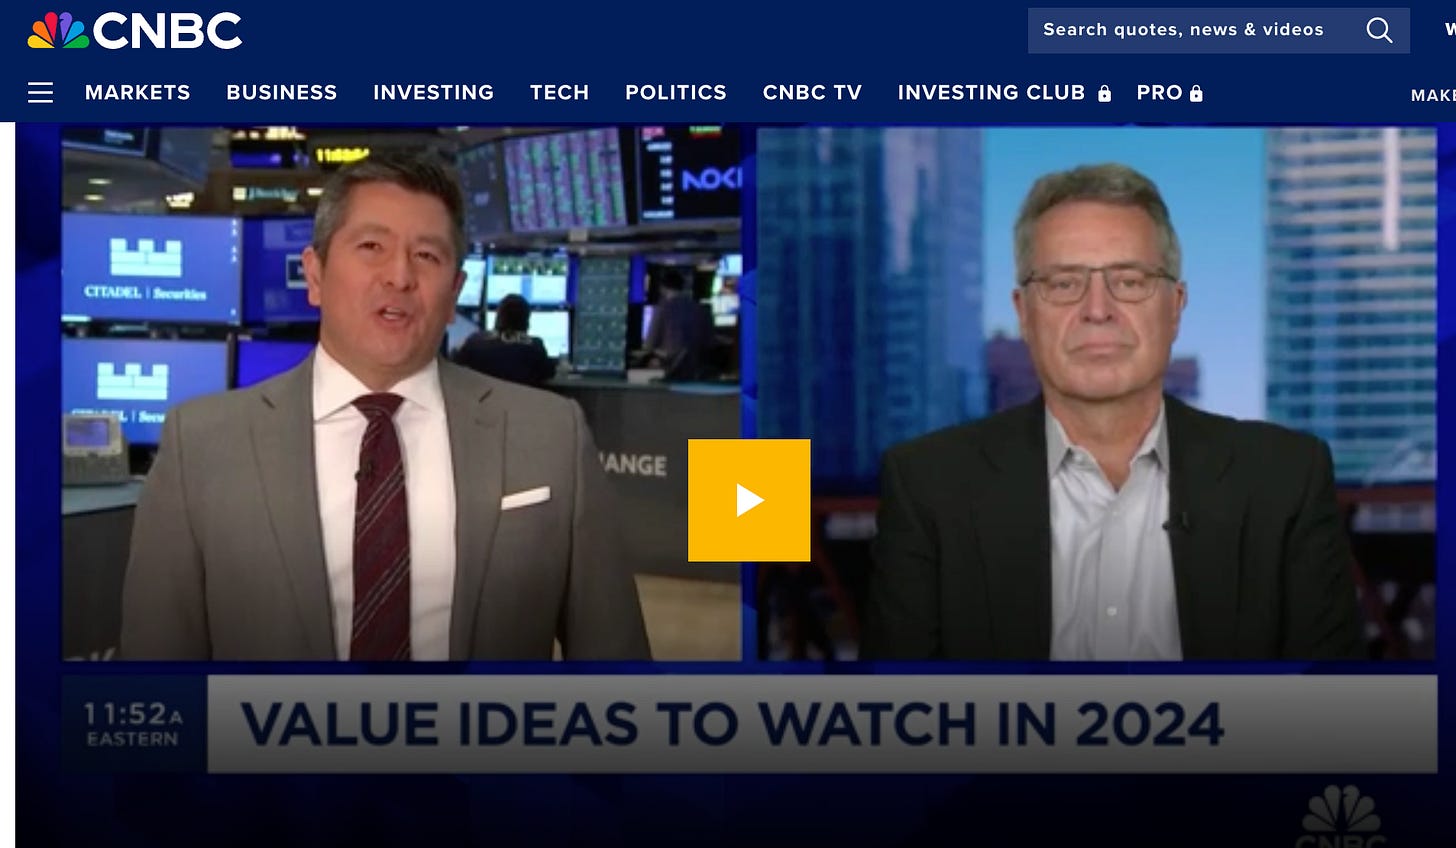
I liked this interview with Bill Nygren from Oakmark. He articulated my similar views on big cap US banks like Citi, and autos (GM). I own Conoco too.

Fund Flows

Going over ICI fund flow data (ETF’s + LT mutual funds) I note that despite the US market doing well there have been no net inflows.

, 10P80 
18b8 
18 8 
) , 08 
50 00 
Cumulative US Equity Flows (ETF'S and Mutual Funds) 2021 , n 2024

The money is going into bonds $400 bn cumulative since 2021 and to a lesser extent international $120 billion.

I read this as retail afraid to buy the top in the S&P and looking for steady yields (bonds) and markets which have lagged.

Is this actually bullish for the S&P?

BofA January 2024 Fund Manager Survey

Let’s wrap up with charts from the January BofA Survey.

I call this the most important chart in the market, and it got even more extended.

The extent to which this is right or wrong is goign to drive everything.

This post is for paid subscribers

Already a paid subscriber? Sign in
© 2025 YWR
Privacy ∙ Terms ∙ Collection notice
Start writingGet the app
Substack is the home for great culture

Share

Copy link
Facebook
Email
Notes
More