YWR: Your Weekend Reading

YWR: Your Weekend Reading

Share this post

YWR: Your Weekend Reading
YWR: Killer Charts
Copy link
Facebook
Email
Notes
More

YWR: Killer Charts

Erik's avatar
Erik
Sep 06, 2023
∙ Paid
12

Share this post

YWR: Your Weekend Reading
YWR: Killer Charts
Copy link
Facebook
Email
Notes
More
1
Share

Usual disclosures: This is just market commentary. This is not investment guidance or advice. For that seek professional help.

First, I want to go through a few sentiment charts/images.

Then I’ll tell you what I think.

This caught my eye on X.

I’ll add Gerard Minack and Alpine Macro to this list.

Heisenberg 
e @Mr_Derivatives • Aug 28 • 
Michael Kantrowitz - bearish stocks 
Michael Hartnett - bearish stocks 
Michael Wilson - bearish stocks 
Michael Kramer - bearish stocks 
Michael Gayed - bearish stocks 
Michael Burry - bearish stocks 
What do they all have in common? 
Anyone? 
Q 701 
to 122 
1,140 
648.5K

As did this. Michael Burry shorting the S&P again.

Compounding Quality e @QCompounding • Aug 27 
Replying to @QCompounding 
Recently, Michael Burry bet heavily on a market crash ($1.6 billion): 
WILL STOCK 
MARKETS CRASH? 
BIGSHORT'tSHORTSACAW 
18 
0 64 
/ 22:40 
Illi 30.2K

The S&P institutional manager survey for August.

PM’s are bearish.

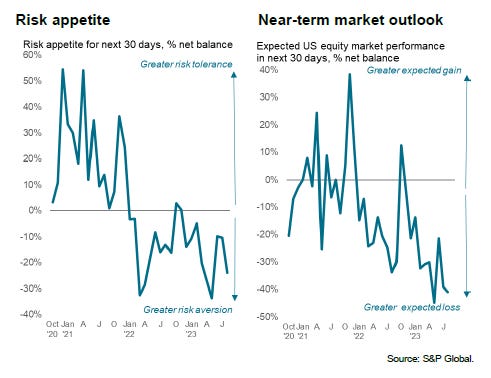
PM’s think earnings forecasts are too high and will likely fall.

US stock markets have done well this year, but retail investors aren’t buying it.

Fund flows into US and European equities are negative.

They keep pounding the UK.

Positive flows have been into Japan and China (surprisingly).

Image of a chart representing "All Equity Fund (diversified and dedicated) flows YTD in US$ million to/from major emerging and developed markets
Source: EPFR

Nobody likes High Yield or EM debt. 3 years of outflows.

Top to bottom that’s $120 billion out of High Yield.

Image of a chart representing "Cumulative weekly flows (in US$ million for High Yield and Emerging Markets Bond Funds over the past five years

And of course the real winner on flows has been Money Market funds.

Almost every year Money Market funds do well. Money market funds are up to $5.5 trillion now.

Image of a chart representing "Annual/YTD flows (% of AUM) for major fund groups, 2016-YTD
Source:EPFR

Europeans piling into bonds too.

Image of a chart representing "Cumulative weekly flows and performance for Europe Bond Funds, 2020-YTD
EPFR

Can I say what picture this paints?

And ‘What could be the money making trades?’

This post is for paid subscribers

Already a paid subscriber? Sign in
© 2025 YWR
Privacy ∙ Terms ∙ Collection notice
Start writingGet the app
Substack is the home for great culture

Share

Copy link
Facebook
Email
Notes
More