
YWR: Killer Charts

The backdrop to March’s Killer Charts presentation.
I continue to go out on a limb on 2 points.
#1 Investors are fretting about a war which is basically over. The Iran war was won in the first 2 days. Now it is like a chess match where the opponent has 2 pieces left and you have to chase them around the board. It’s already checkmate, but they don’t want to concede. Yes, miracles can happen, and maybe the IRGC finds a way out of the position they are in, but personally, I don’t see it.
The Iran War may be regarded in the future as the most amazing operation in US military history; the complete top to bottom takedown of a large, modern financial opponent in 3 weeks.The IRGC blundered in every possible way, but the biggest was attacking the rest of the Persian Gulf and alienating themselves.
On Hormuz, the IRGC is already letting tankers from India, China and Japan exit, which means the bottleneck is leaking. And strategically for the IRGC, continuing to restrict Saudi oil exports risk bringing in a 3rd nation state against them, so it’s not a tenable position. The most likely outcome is a settlement between the US and non-IRGC factions.
#2 Investors are gaming out the collapse of the world chemical supply and a recession due to closure of the Straights of Hormuz, but overlooking the global boom underway. It is a risky set up to get bearish about a war which has already been won, when S&P EPS estimates are going vertical. Which is why I think the market will make new highs (4 reasons we make new highs).
This month’s Killer Charts deck is 26 slides with the following sections:
Investor sentiment
S&P 500 Earnings Estimates
India’s Boom.
The full presentation is at the bottom of the post.
Below are 10 highlights.
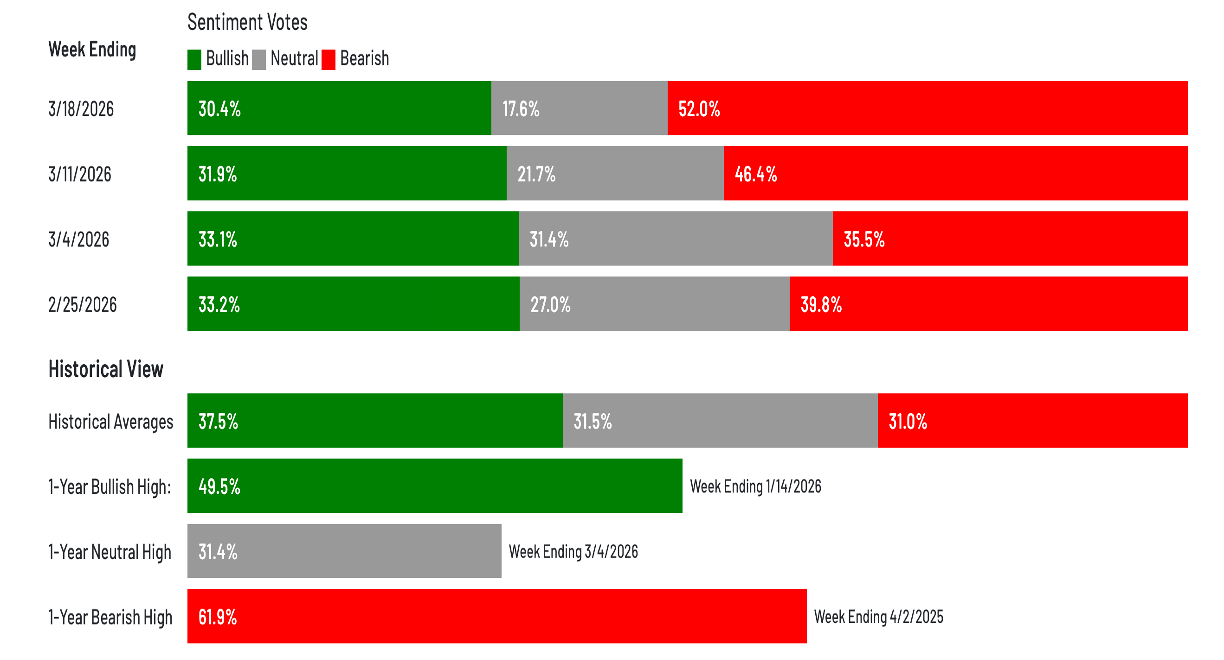
#1. 52% of investors are bearish. We have reset the extreme bullishness from earlier this year. This is a good starting point for another move higher.
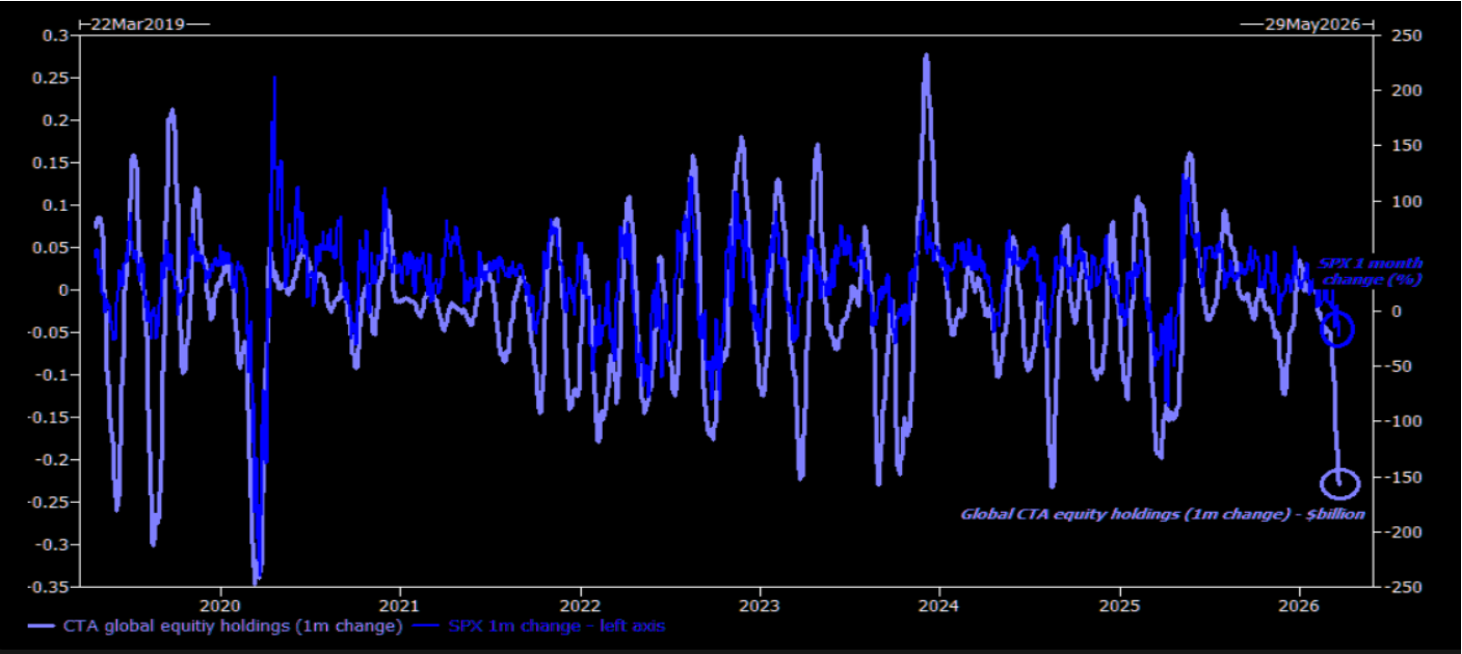
#2 CTA’s have liquidated a record $150 billion in global equity holdings 1 month. Again, a positive starting point for a rally.
#3 S&P 500 EPS earnings estimates are curling upwards. Why? Because there is a massive boom underway. Sharply rising earnings is also suggestive of a market which goes higher.
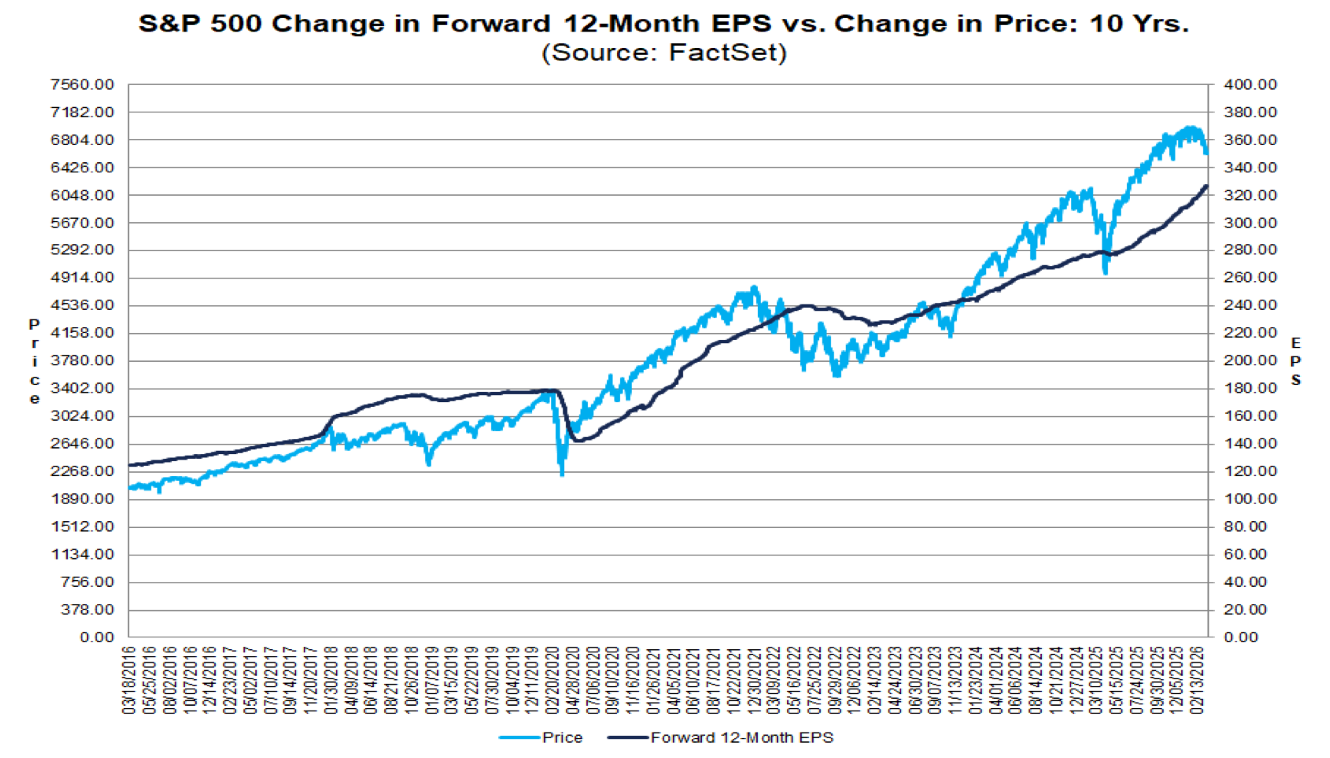
#5 Estimate revisions are positive. Analysts are raising, not lowering numbers.

08/11/2025
08/18/2025
08/25/2025
09/02/2025
09/09/2025
09/16/2025
-CY 2026 Bottom-Up EPS
09/23/2025
09/30/2025
10/07/2025
10/14/2025
10/21/2025
10/28/2025
11/04/2025
11/11/2025 3
11/18/20255
11/25/2025
12/03/2025
12/10/2025
12/17/2025 3
12/24/2025
01/02/2026
01/09/2026
01/16/2026
01/26/2026
02/02/2026
02/09/2026
02/17/2026
02/24/2026
03/03/2026
367.80
03/10/2026
316.16
03/17/2026")
INDIA
We need to turn our focus back to India. It’s part of the global boom thesis and will be a driver of the surprise in global energy demand. India is at a similar inflection point to China in 2004 where they now have enough income for discretionary spending.
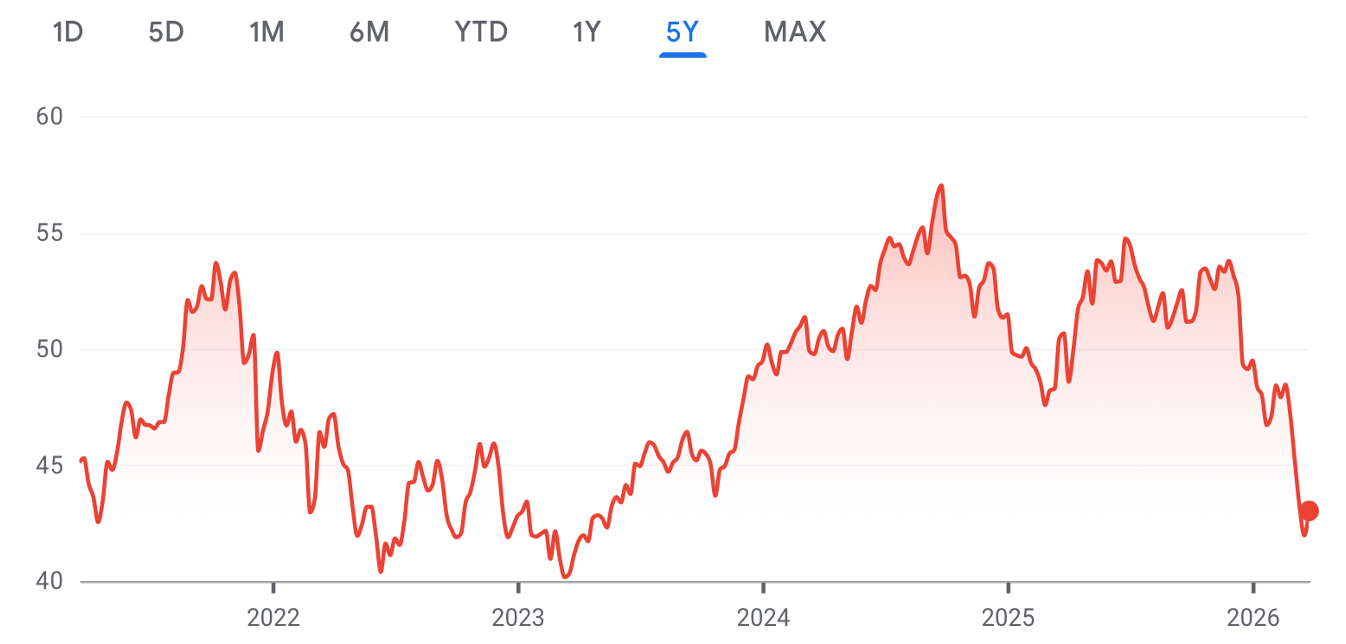
#6 Indian stocks are starting to look interesting (for the first time in a long time). The Indian market has had a big sell-off. Investors are negative and the view is Indian IT professionals will be AI losers. This view could be misplaced though. I share some slides from the Infosys AI day.
#7 India may be an AI winner. AI favours ‘build’ over ‘buy’ and may actually be great for Indian IT services companies. I see this myself. The AI models form a base, but what you build on top of it, to be differentiated, is highly customised around a firm’s data and workflows. It’s consulting heavy and also will require ongoing maintenance.

#8 India’s GDP/capita crossed $2,500 adding 1.3 billion consumers to the global consumption population. India has hit is the China 2004 inflection point and it’s another driver to the global boom story.
There have never been this many global consumers in the history of the planet!!
