

Sometimes you fish.
Sometimes you mind the nets.
It’s fun to hunt for new things to buy, but we also need to monitor what we have.
The X’ing is in the holding.
Let’s go over a few thoughts on the 1H results from:
Unicredit
Barclays
Santander
Glencore
BP
Links to my updated models for Unicredit, Barclays, Santander and Glencore are on the YWR website.
The Dirty Dividends portfolio.
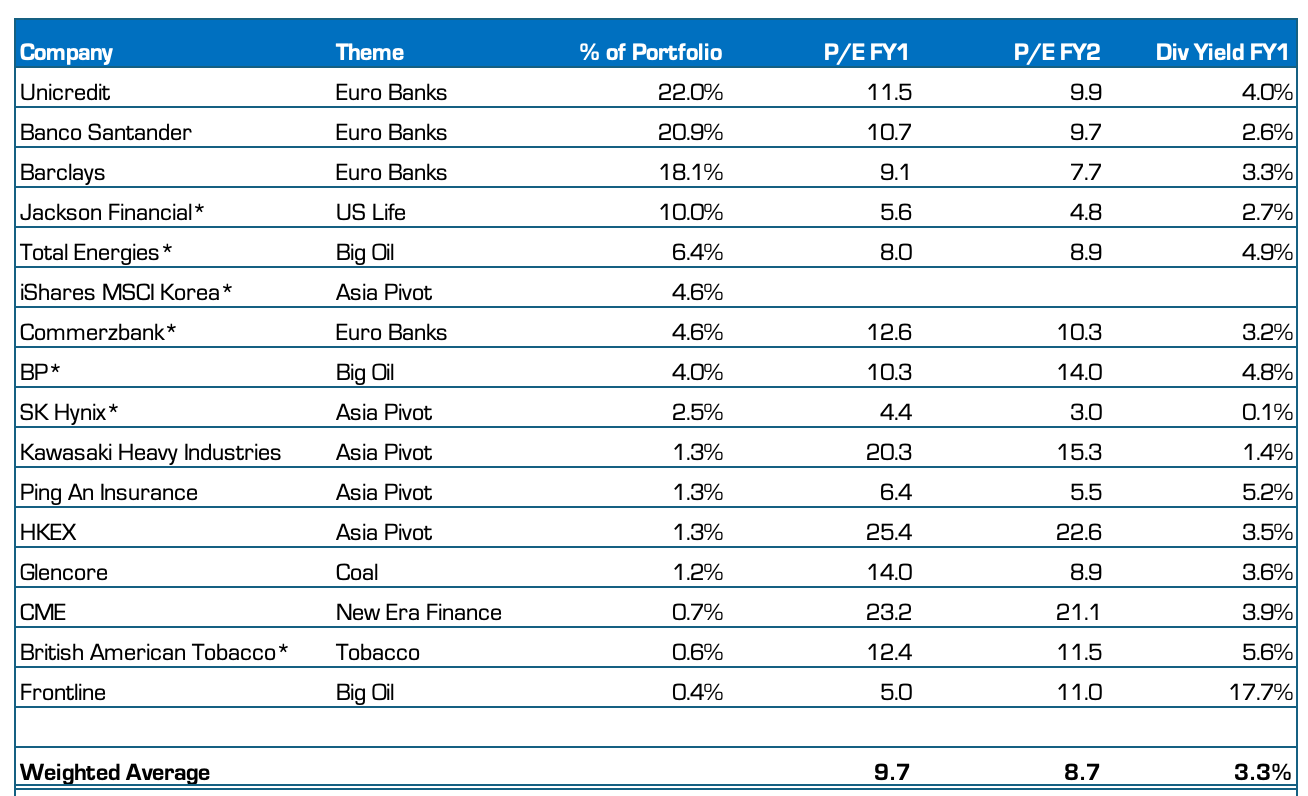
European Banks - from stability to growth.
It took awhile, but we are shifting into the growth stage.
The play in 2021 (How I learned to love European Banks) was that European banks were hated, yet well capitalised and about to benefit from a rise in net interest margins.
That investment case evolved into what we see today. A more stable business model which converts 7% revenue growth, 0% cost growth and share buybacks into steady eddy 15% EPS growth with low capital requirements. Our view was investors would gradually see the value of this model (even if it was not sexy) and rerate the banks from P/E’s of 6x to 10x. Which is where we are today.
But growth in lending and capital markets is what takes us higher from here. Plus potentially another rate hiking cycle.
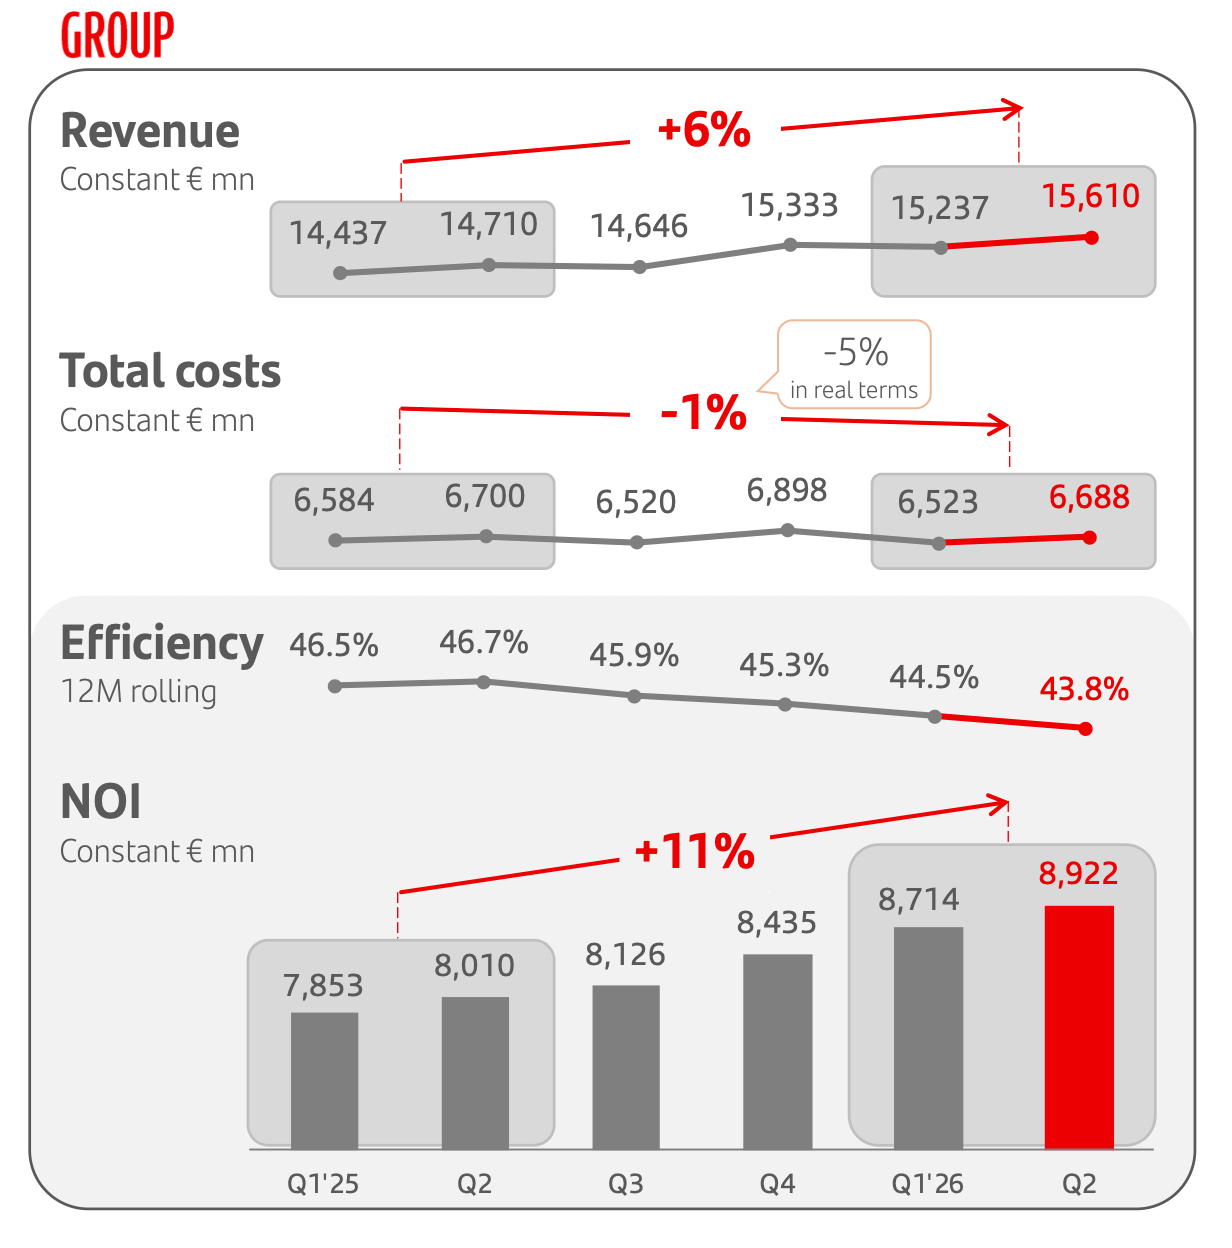
Santander’s 1H 2026 results are the clearest example of the new normal; single digit revenue growth and double digit profit growth.
6% revenue growth
1% decline in costs
+11% operating income
14% profit growth.
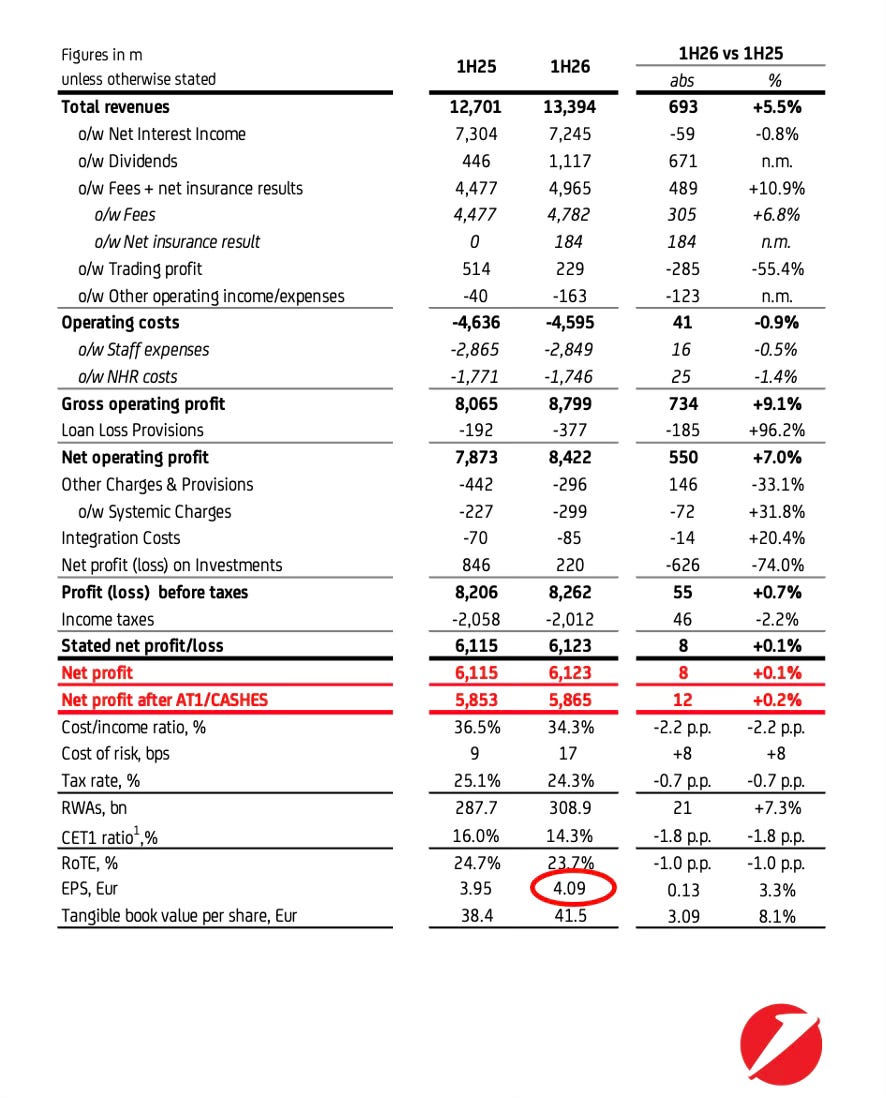
Unicredit results are messy because they have been accumulating stakes in Commerzbank (49%) and Alpha Bank in Greece (29%) which show up across both the dividend income line and the investment line with the hedging of the stakes in the trading profits line.
If you back out all these effects you see:
7% revenue growth
1% cost decline (34% cost income ratio)
12% Gross Operating Profit growth
1H 4 EUR/share in EPS (with full year consensus at EUR 7.4).
Cost Income ratios - The unsung hero
One of the surprises for me in this trade has been the cost income ratios. I never expected to see reported costs (not adjusted costs) declining. I always model in 3% cost growth despite what the CEO’s guide and so this has been a constant positive surprise.
I’ve never seen a 34% cost/income ratio like at Unicredit at a DM bank before. It seems weird, but I think these are the delayed effect of banks moving to the cloud. Cost/income ratios might go even lower as AI is implemented. Banks seem like fertile ground for automating back office operations with AI.
What if Santander can get into a high 30’s C/I ratio (from 44%) or Barclays into the high 40’s (from 55%)?
Signs of Growth
We’ve always had a view the social pendulum in Europe, the US and Japan could swing 180 degrees from politicians and regulators hating banks and telling them not to take risk to encouraging banks to “help support small businesses” and grow the economy (‘take risk’).
There are signs this is happening. After years of deleveraging, loan books are growing again. Interestingly, it is happening mostly in large commercial loans. This cycle corporate banking appears to be where demand matches the banks’ appetite to lend.
1H 2026 loan growth versus year end 2025 (6 months).
Unicredit + 10%
Santander +6%
Barclays 3%
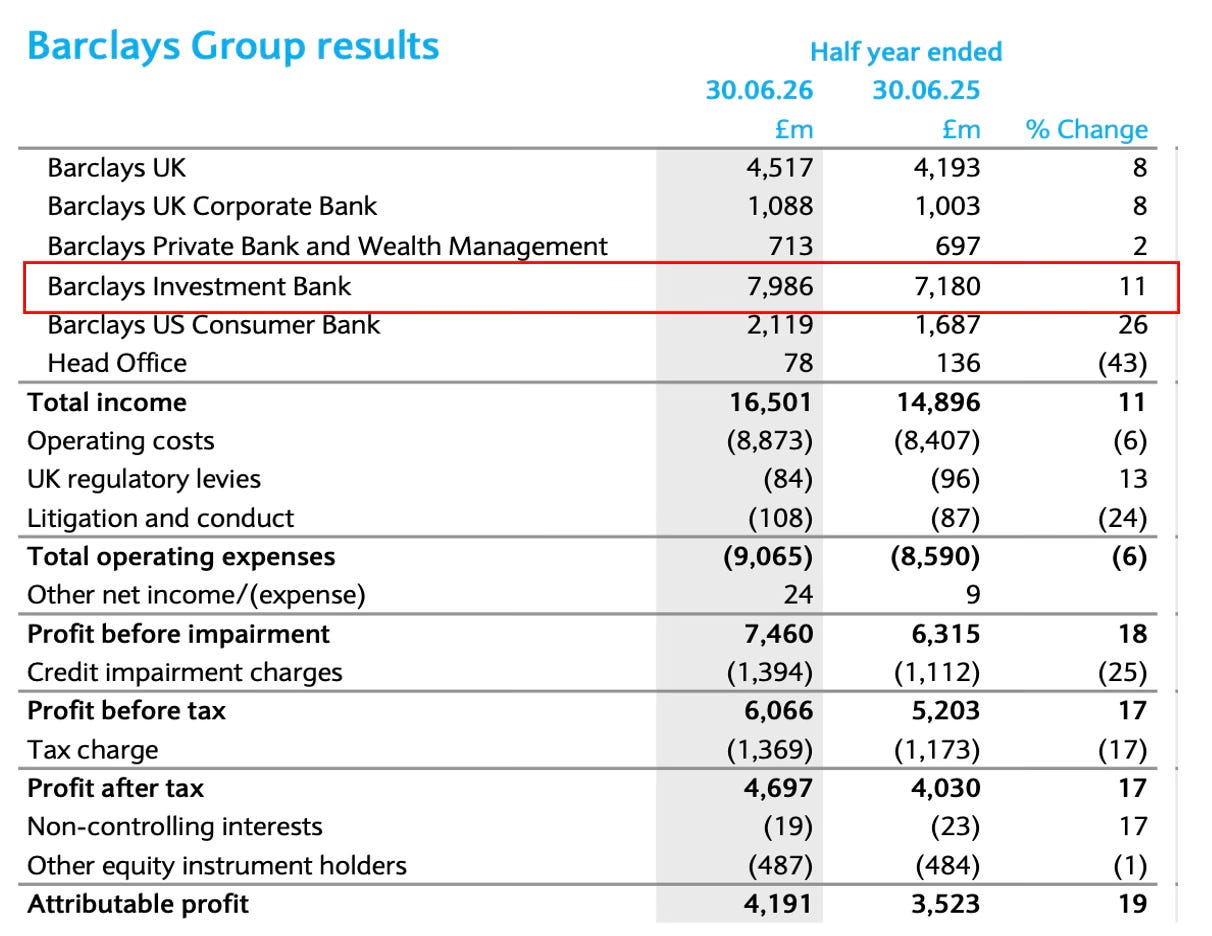
The other sign of growth is IB earnings at Barclays and Santander. Both are benefitting from strong US capital markets. In Q2 Barclays grew investment banking profits 32%.
Putting it all together
