YWR: Slide #18. The Money Slide
Disclosure: This is personal market commentary. These are not investment recommendations or guidance. For that seek professional help.
What do you do when all the smart people are getting something totally wrong on a stock, or an entire sector?
You hit it hard. That’s where there’s opportunity.
And it’s why I keep going on about European banks.
The Choice
Today I had a choice.
My wife said she wasn’t happy with the layout of the pictures in our apartment and was going to rehang most of them. My younger daughter was excited about this project and was going to join in too.
Oooof. How painful. But I managed the obligatory ‘How can I help? What should I do?’
But my wife saw right through me and said, “If you want to hang pictures, and really want to, and are going to be pleasant, then we would love your help. But only if you want to. Otherwise, you are free to go to a coffee shop and do some work.”
I’m always wary of these ‘choices’. But I really didn’t want to hang pictures.
“I can really go to a coffee shop? And you won’t be mad?”
“Yes. We only want your help if you want to.”
It sounded sincere, and not a trick, so I chose the coffee shop.
30 min later I had a ‘Super American’ going (Americano with an extra shot) and was finally working on an earnings model for Barclays Bank. The cheapest bank in Europe.
To me it’s strange Barclays is so cheap. Yes, it’s one of the big UK banks, but it’s the premium bank and somewhat exclusive. I’ve been trying to think of a US equivalent, but can’t find the right comparison. Having a Barclays corporate bank account is kind of ‘a thing’. It signals credibility.
So why are Barclays share trading at 0.4x book and a PE <5x when it’s profitable and there are no asset quality problems? I needed to sit down and really do the numbers.
Barclays 1H 2023 Results
A few interesting things pop out as you go through the 1H results. Like slide #4.
Barclays is growing the dividends and the share buybacks.
The share count is steadily falling.
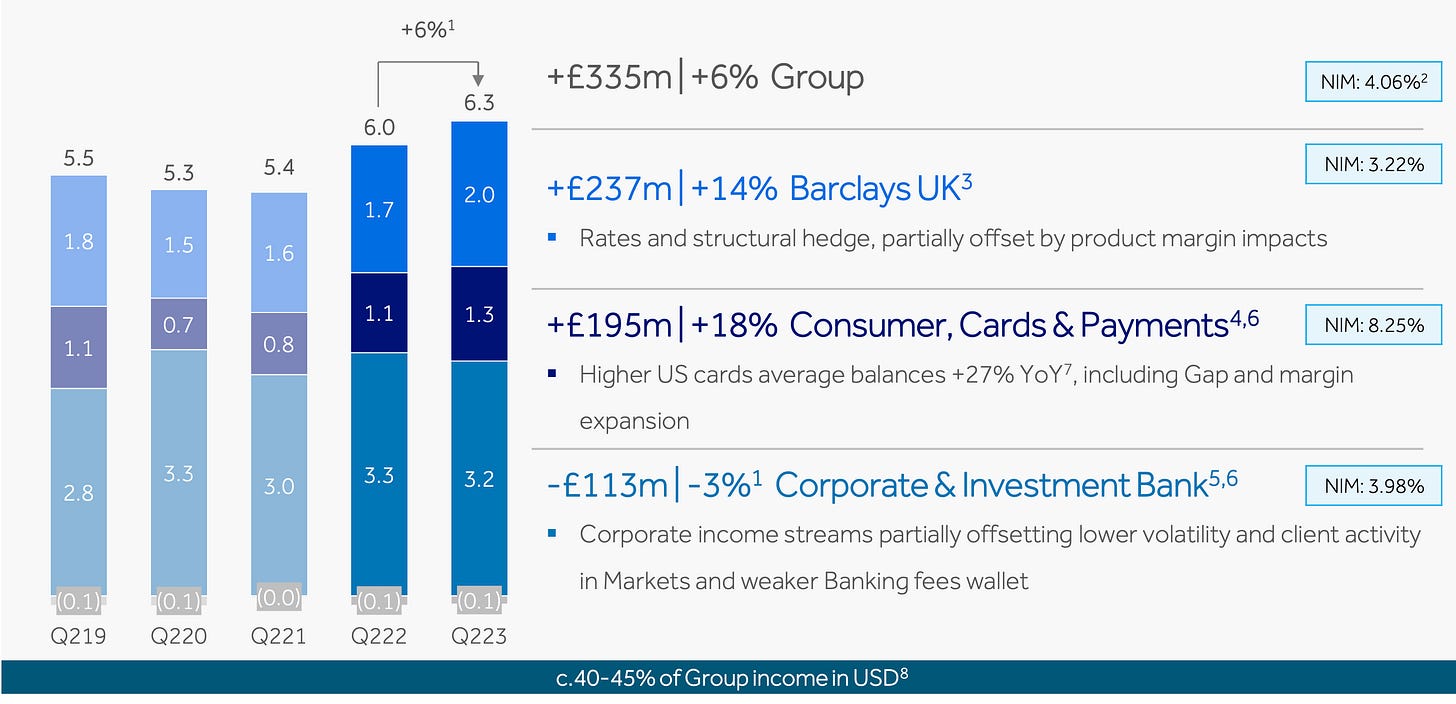
Then in slide 9 you see investment banking is sluggish, but overall revenue growth is picking up.
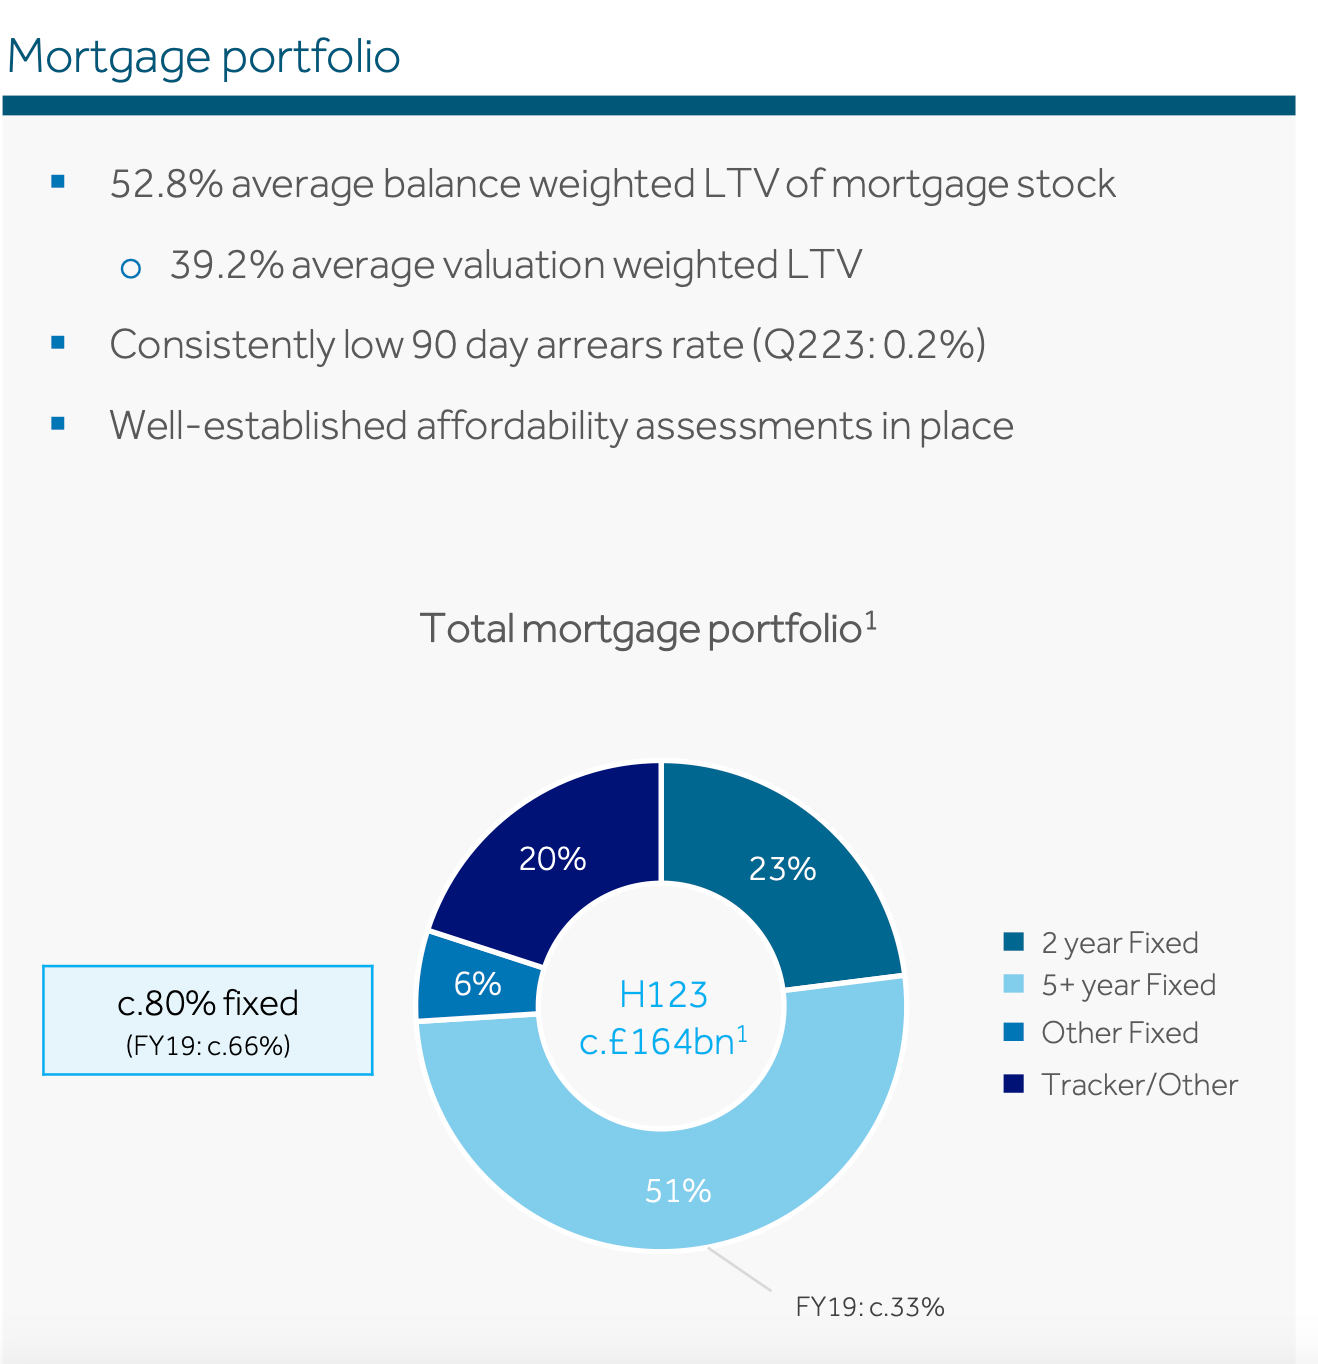
By slide 14 we get into the loan exposures, everyone’s fear. Just note ‘loans’ are only 22% of the £1.5 trillion balance sheet. The rest is cash (24%), bonds and trading securities.
People get apocalyptic about the outlook for UK housing and so are worried about every bank’s mortgage loan exposure. Barclays is not the main player in UK mortgages, so their portfolio is only £164bn, or 11% of the balance sheet.
The loan to value (LTV) on the whole residential mortgage portfolio is 39%. Meaning, Barclays does quite well if you get into trouble and decide to default rather than just sell your house. Are UK house prices going to go down by over 50%?
Another area investors fret about is commercial real estate (slide 15). Like with mortgages, the devil is in the detail and it doesn’t look that concerning. The total exposure is £17bn, of which office is less than £2bn. That’s £2bn out of a £1.5 trillion balance sheet. Like with mortgages the LTV is 51%. Interesting that the logistics exposure is almost as big as the office exposure.
Slide 18
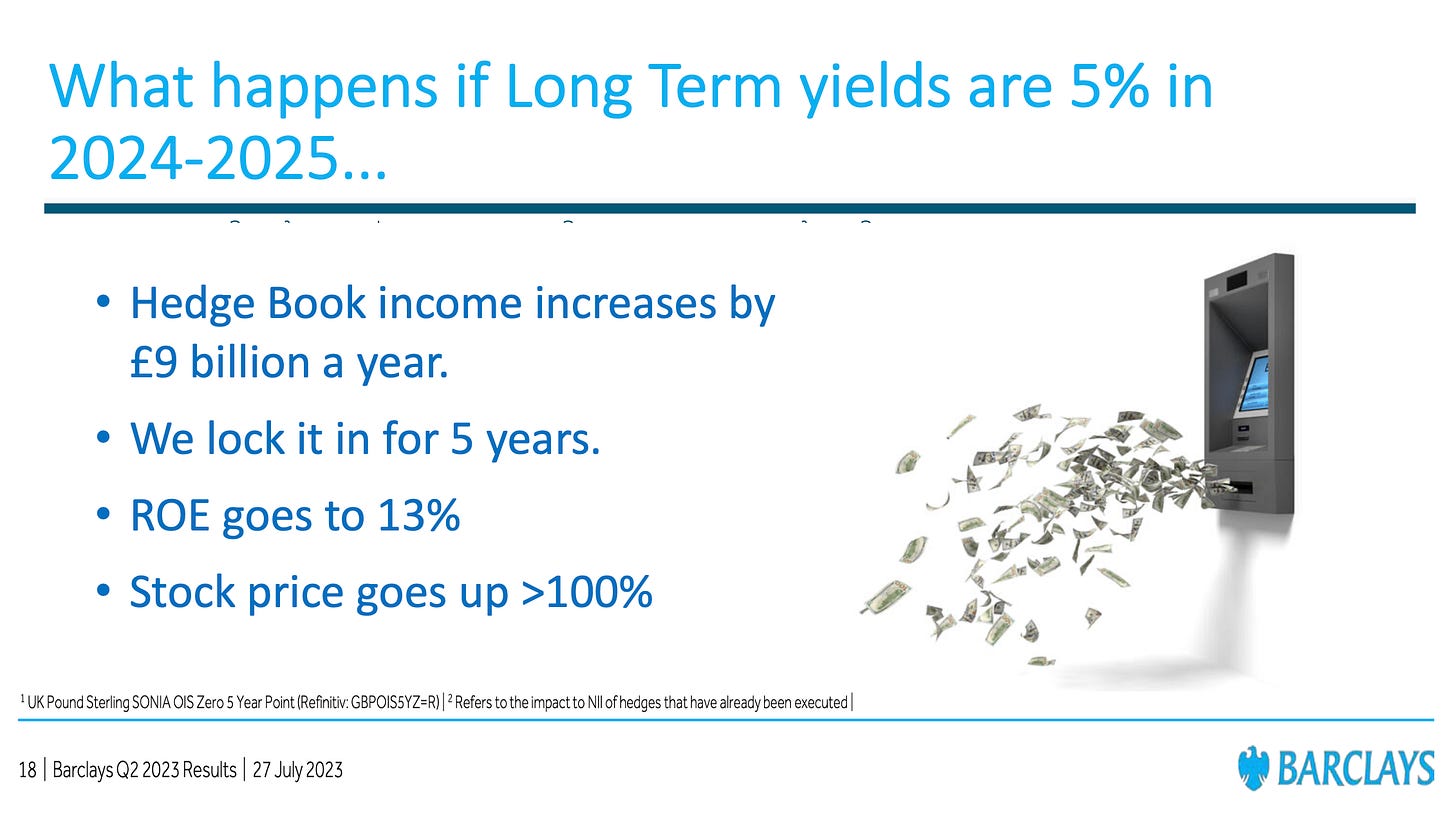
Then we get the doozy. Slide #18… the money slide.
So what’s going on here?
A few years ago Barclays decided to invest £256 billion into a long term interest rate swap portfolio. The idea was to smooth out the swings in their net interest income, but their timing wasn’t great. They built up most of this £256 billion portfolio when rates were zero and basically ‘locked in’ low interest rates for 5 years during 2020-2021. As you see the average yield on this portfolio is 1.26%.
But these crappy yielding bonds Barclays bought in 2020-2021 at <1% are quickly rolling off (£50 bn of maturities a year or 20% of the portfolio) and Barclays is reinvesting the money at the current 5 year swap rate, which is 5%!!!
So what happens if you take a £256bn portfolio yielding 1.3% and reinvest it at 5%? The income goes from £3.3 billion/year to £12.8bn!!!
Do you see how the blue bars in the chart fade up ambiguously into white space in the year 2025? That’s because £12 billion doesn’t fit on the page. It is literally ‘off the charts’.
During the conference call this chart got a lot of interest from the analysts. The chart suggests a large potential margin improvement, but the CEO, Venkat, kind of downplayed it. Venkat is trying to be conservative, and I understand why he does it. The key uncertainty to this chart is what 5 years swap rates will be in 2024-2026, and the market consensus is that we are going to have a big recession and rates will drop. So these rates won’t last.
But what slide 18 is also showing is that if for some reason we get a miraculous scenario where the 5 year swap rates stays at 5% for the next 2 years, just steady eddy, and Barclays is able to mechanically roll over the £256 billion at 5%, it is going to be a bonanza. But nobody thinks that is going to happen, because ‘everyone knows’ rates are going to fall.
Here is how I would have made slide 18 if I was Venkat.
And this is the crux of what the ‘smart analysts’ are missing with the European banks. Yields have moved massively, but the stocks and their earnings estimates have not.
For some reason everyone understands that 0% interest rates are bad for banks and net interest margins, but somehow the market isn’t willing to accept that 5% rates are good.
The Net Interest Margin Regression Analysis.
Look at this chart below. It’s 25 years of the relationship between UK 5 year yields and the Barclays net interest margin.
Do you see a correlation? Good, because for some reason UK banks analysts don’t.
When yields were high back in the late 1990’s Barclays would earn margins over 2%. Then,as we know, 5 year yields when to 0% and it was hard for Barclays, and every bank, to make a spread and the net interest margin collapsed (white line).
Now do you see the importance of the rise in the 5 year yield (blue line)? It’s the good old days again. It’s just a matter of time. Barclays needs time (2024-2025) to roll their balance sheet into these higher yields.
For fun I even did a statistical regression analysis to see where it would predict the NIM. I loaded 25 years of UK 5 year yields and the Barclays NIM.
Here’s what it spit out.
NIM = 0.57% + 0.18* (UK 5 year yield)*
*I used the 5 year government yield not the swap rate.
Now let’s put that into our computer and what do we get?
A Net interest margin of 1.4%. In 1H 2023 this # was 83bps.
If I stick a 1.4% margin into my model then in 2025 Barclays earns 67p/share. That would put the bank on a P/E of 2.3x and a likely dividend yield over 13%. Crikey! I’m trying to be more conservative with my numbers and say we get to 1.2%.
The whole world has changed for Barclays, but look at the share price. Zzzz. Nothing.
So what’s going on?
I went on Bloomberg and found some ‘Bloomberg Intelligence’. It’s an article about whether European banks are a value trap. They point out that yes, European banks are trading at the lowest valuations ever (P/E’s <6x), but it’s justified because there will be a recession next year.
The European banking sector's rapid derating this year following the US regional banking crisis -- has pushed the sector's valuation to almost 6x 12-month forward price-to-earnings. Such a low level has only being touched briefly twice in recent years, and implies a 6x multiple discount to the wider market, above the middle of the range of recent years.
We think that makes sense, given concerns about the earnings-upgrade cycle turning, with the potential for revenue downgrades and higher credit impairments going into 2014. Cost-of-risk angst is elevated, with an economic slowdown anticipated across the euro zone, though the buffers built during the early stages of the pandemic should make conditions manageable.
Can I say something?
This ‘Intelligence’ is the problem. Yes, it captures the consensus view, but it’s wrong. It misses completely the math of rising net interest margins, the math of the size of the loan book relative to the total balance sheet and the LTV’s in the assets.
So I bought some more Barclays.
No it’s not Tesla, and I don't expect anyone to like banks, or ‘get it’, but if inflation stays sticky, and UK 5 yrs, bob along here at 5% for another 1-2 years, Barclays is going to make money like the good old days and the share price is not going to be 0.4X book. In the meantime I’ll take 10p in divs this year (6.5% yield) and then 19p next year (12% yield). My estimates.
I’ve put in a link below to the model I built. The key numbers (highlighted in yellow) are the net interest margin and the credit costs.
Now I better hurry home and see if I can get back just in time to be helpful and hang the last 1 or 2 pictures.
Have a good weekend.
Erik
Barclays Model below and also in the Data & Models section on www.ywr.world.


