
YWR: What if the 'AI Bubble' is a Capex Boom?

AI is a bubble.
You know that right?
It’s common knowledge.
It’s why investors are on edge all the time. Always wondering how long they before the crash. Or what’s the best way to play a crash.

I want to make 2 points. The first point is easier than the second.
$400bn of AI capex is not that big a deal in the context of annual global capex of $4.5 trillion.
We could be in the early stages of a wider capex boom.
Global Capex Data
I took the 10,000 companies from the YWR Global Factor Model and pulled their annual capex back to 2024. I then grouped it by country and industry.
This data exercise has many flaws, but it’s the best we can do.
Data Flaws:
This is capex for a panel of companies listed today, and does not include companies listed in 2000, which dropped out of the data. This means recent year capex will be biased upwards. For example, Meta wasn’t listed in 2000, neither was Saudi Aramco.
We are not capturing capex by private companies or state-owned enterprises which are not listed. This is likely significant for China.
There is an abnormal drop in the data for 2017 capex. It makes sense for US capex to be depressed in 2017 because of the U.S. Tax Cuts and Jobs Act of 2017 (TCJA) which provided incentives for capex in 2018. Companies could have deferred capex in 2017 to 2018 for the tax benefits. But for the rest of the world, the drop looks like a data issue. I made an adjustment to the data and for companies not in the US 2017 capex is the average of 2016 and 2018.
We are using the Factset definition of ‘capex’. Sometimes what gets classified as capex looks funny. When a leasing company buys cars it is called capex. When Strategy buys $22bn Bitcoin that’s ‘capex’ too.
I’m assigning capex to countries based on the country of listing, while the capex may be global. For example, an Exxon project in Guyana gets classified as US capex.
As usual the corporate capex dataset is available at the bottom of the post and at YWR Datasets.
Capex by country
Growth in US capex since 2020 is the stand out trend.
This is likely a combination of the Inflation Reduction Act in 2022 followed by AI capex.
China’s capex grows steadily over the years, but has been flat recently.
France, Germany, Japan are stable in US$ terms.
South Korean capex is growing. Taiwan too.
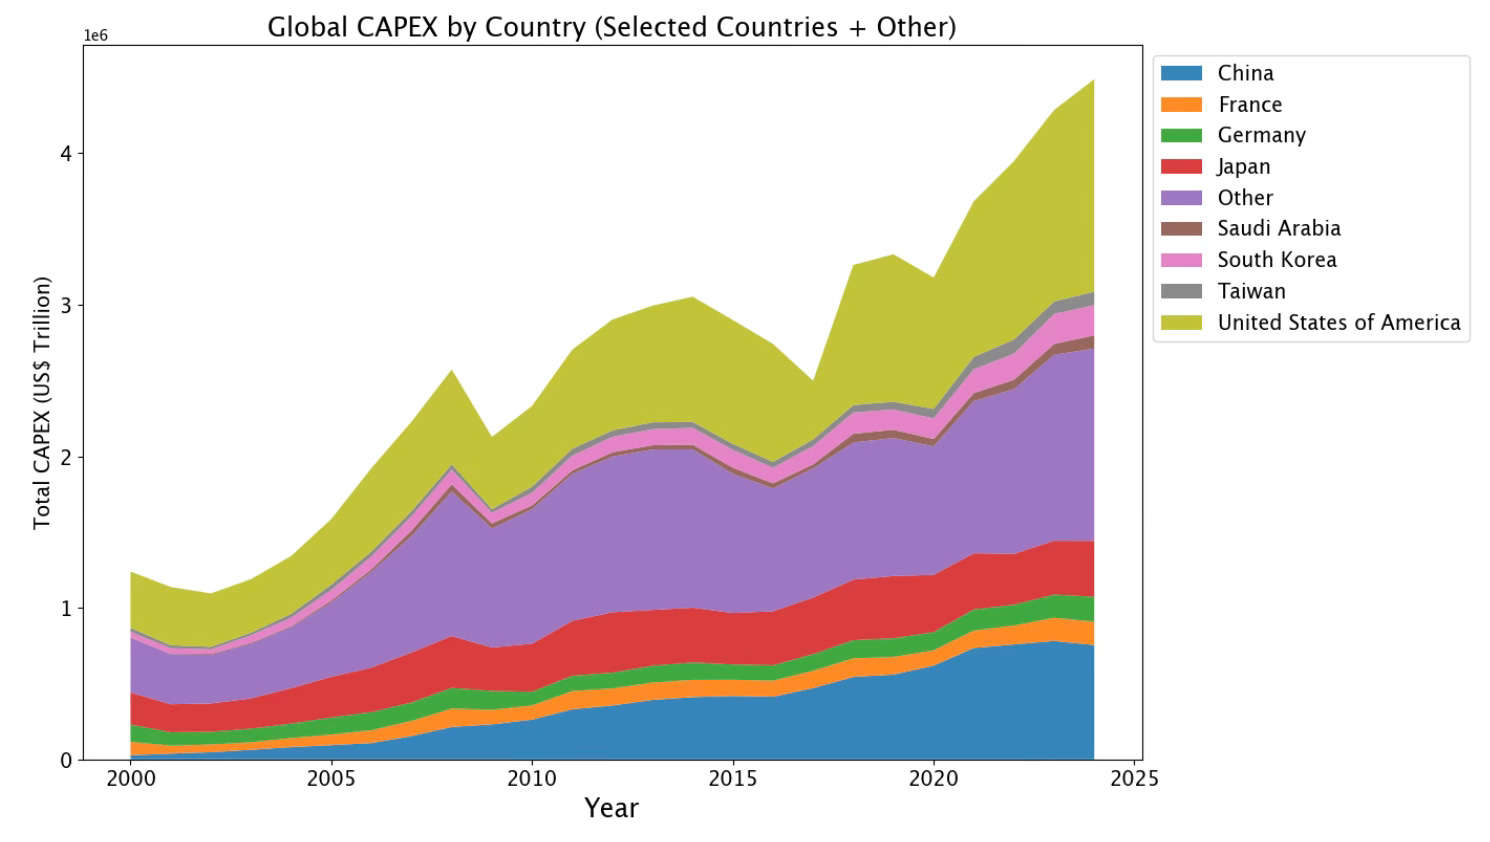
Global capex growth in US$ terms from 2010 to 2024 looks big (+$2 trillion), but when you consider it is over 14 years the CAGR is only 4.79%. And that is in nominal $’s.
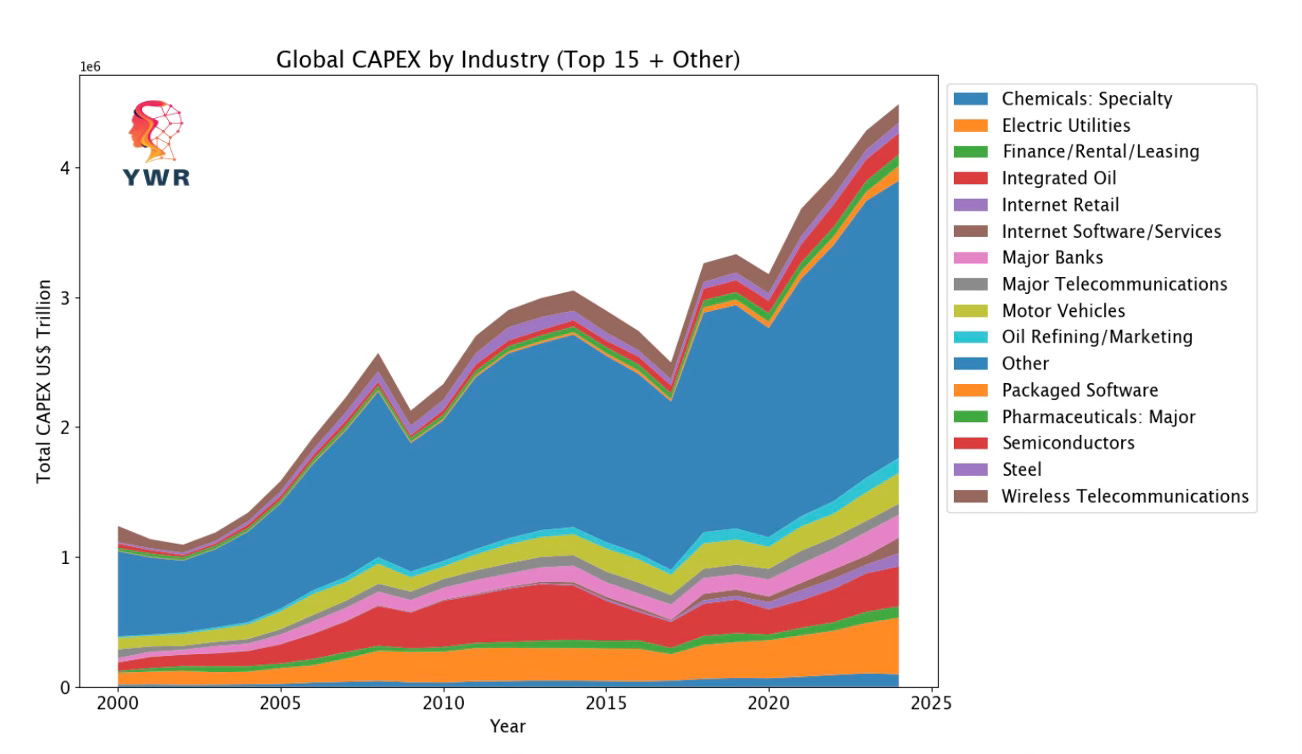
CAGR from 2010 to 2024: 4.79%Capex by industry
When you look at global capex by industry you realise ‘semiconductors’ are not such a big deal. To be fair capex into semiconductors is spilling over into other sectors such as internet retail, and internet software.
But you see that utility capex is also big. And leasing is surprisingly big. Integrated oil where capex has been depressed for years is big. Banks… Motor Vehicles..surprisingly big (but might have a leasing component too). Remember all the money spent on batteries? Mobile telecommunications…. Remember 5G?
Semiconductors is the thin red bar third from the top.
There is a huge swath of industries I grouped into ‘Other’ because they were making the chart too messy.
The point is ‘AI’ and datacenters are getting all the news, but global capex is huge and diversified across many industries you aren’t paying attention to.
If AI spend drops by $100bn in 2027 it is not going to derail the world economy.
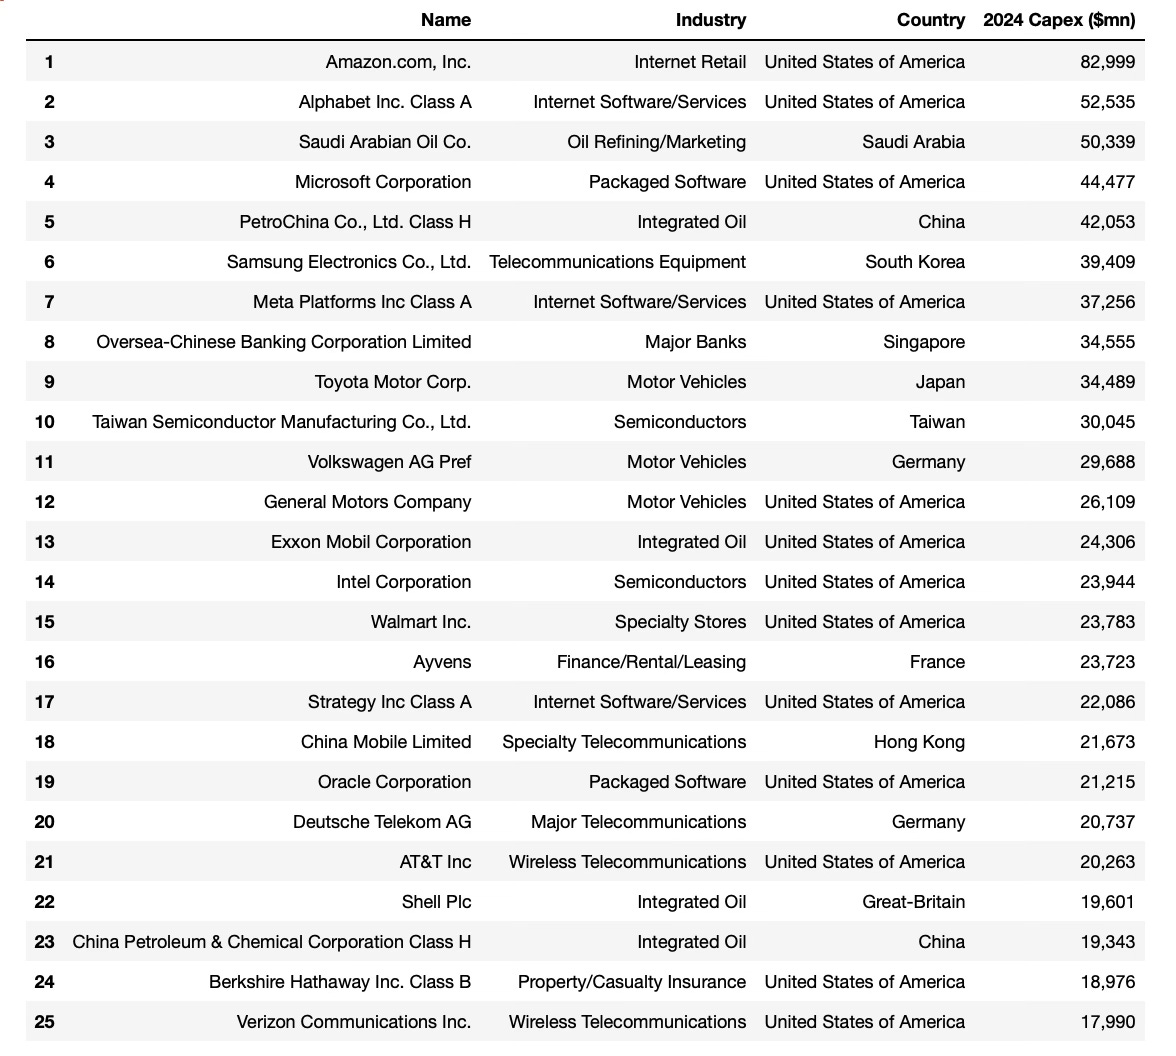
Top 25 Capex Spenders (2024)
We are all focused on Amazon, Google Microsoft, Meta and Oracle but we forget about Saudi Aramco, PetroChina, Samsung, Toyota, VW, Walmart, Deutsche Tell, AT&T, Shell and Berkshire Hathaway. These guys are big spenders too.
What if AI spend falls in 2027, but these other companies spend more and pick up the slack?
Capex as a % of GDP
Next I pulled World Bank GDP data to measure capex as a % of GDP. As flagged earlier, this is a data mess; comparing listed company capex with World Bank GDP, but I did it anyways.
Ignore 2017, and you see we are at the high end of the range for Capex as a % of Global GDP, but it’s a tight range (3-4%) and there is nothing extreme going on.
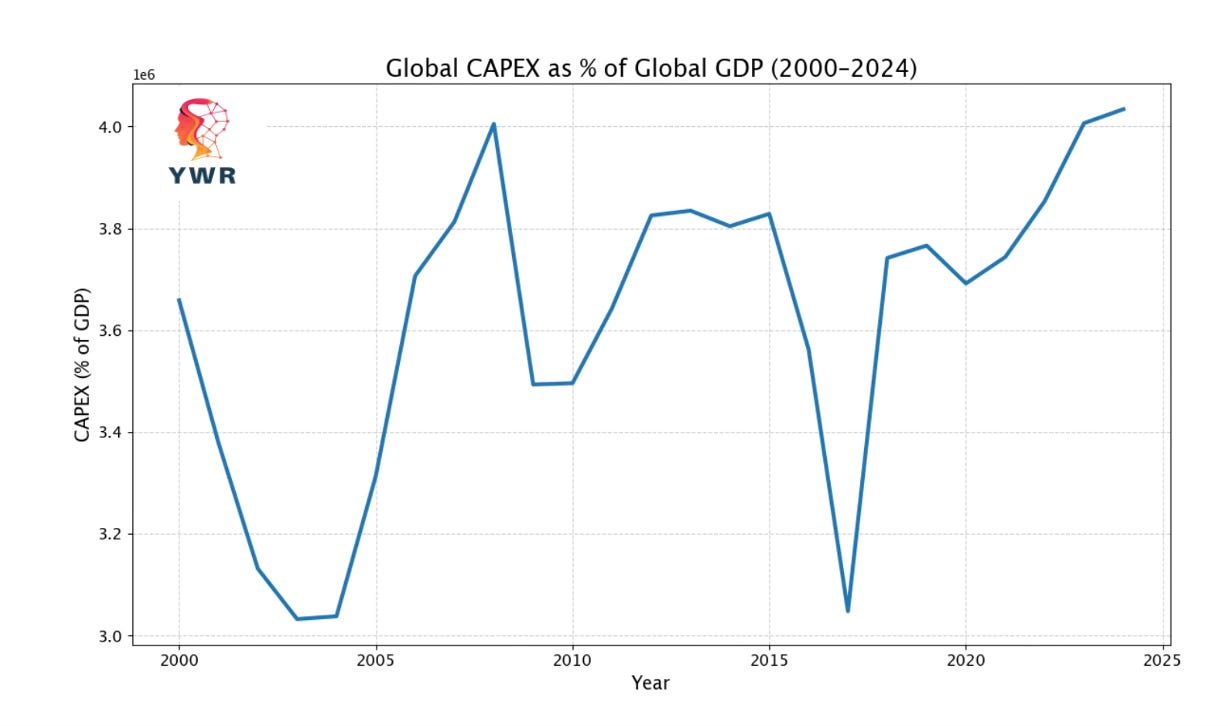
When you look at trends for the individual countries we start to see the potential for point #2.
What if we are in the early stages of a global capex boom and capex as a % of GDP is going to trend even higher?
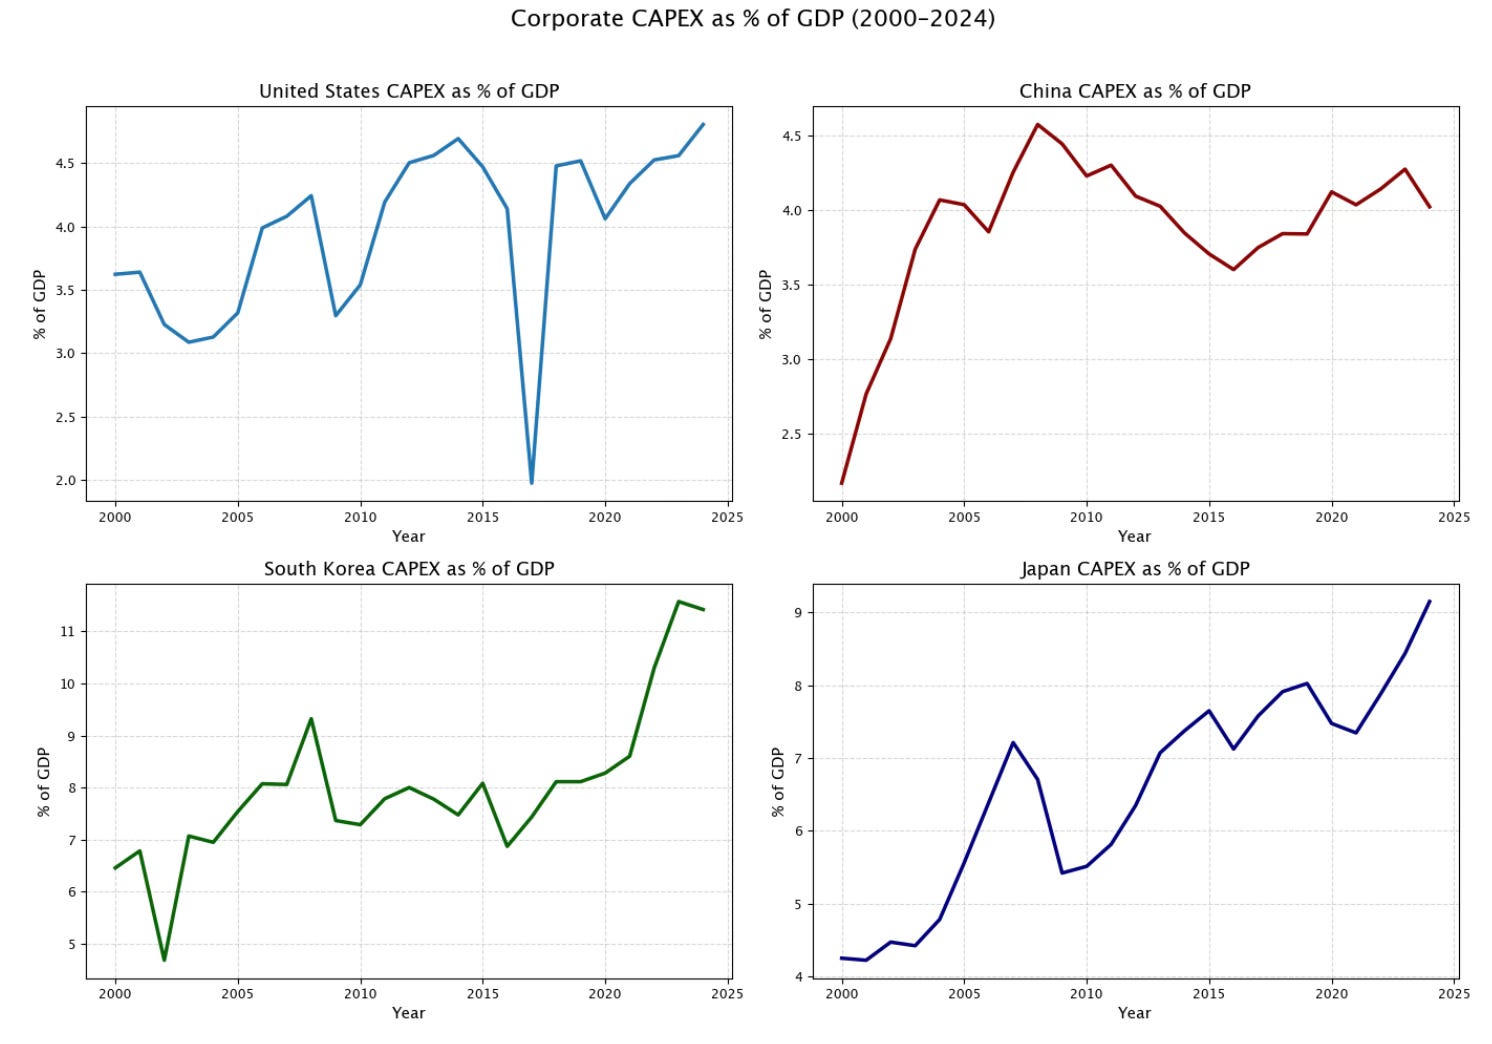
You see US capex trending higher. Close to 5%.
China is flat, but could be about to pick up.
Then you see a big spike for South Korea and Japan to 11% of GDP and 9% respectively.
For the Japan data there is likely an FX effect. Capex in US$’s for the corporates like Toyota, NTT and Nissan is stable, while US$ GDP has declined 20%. But maybe that is saying something also.
Are South Korea, Japan, and the US are the canaries in the coal mine that we are in a new era of higher global capex?
What happens if China decides it needs to spend trillions of $’s on datacenters too?
And what happens when the robots kick in?
You can go through all the individual corporate data trends in the spreadsheet at the bottom other than post.
What if Capex/GDP is going to 7% of GDP in the US?
I know I have a big imagination, but what if it’s not an AI bubble?
What if it’s the opposite?
What if we have effectively infused intelligence into machines and have to rebuild everything?
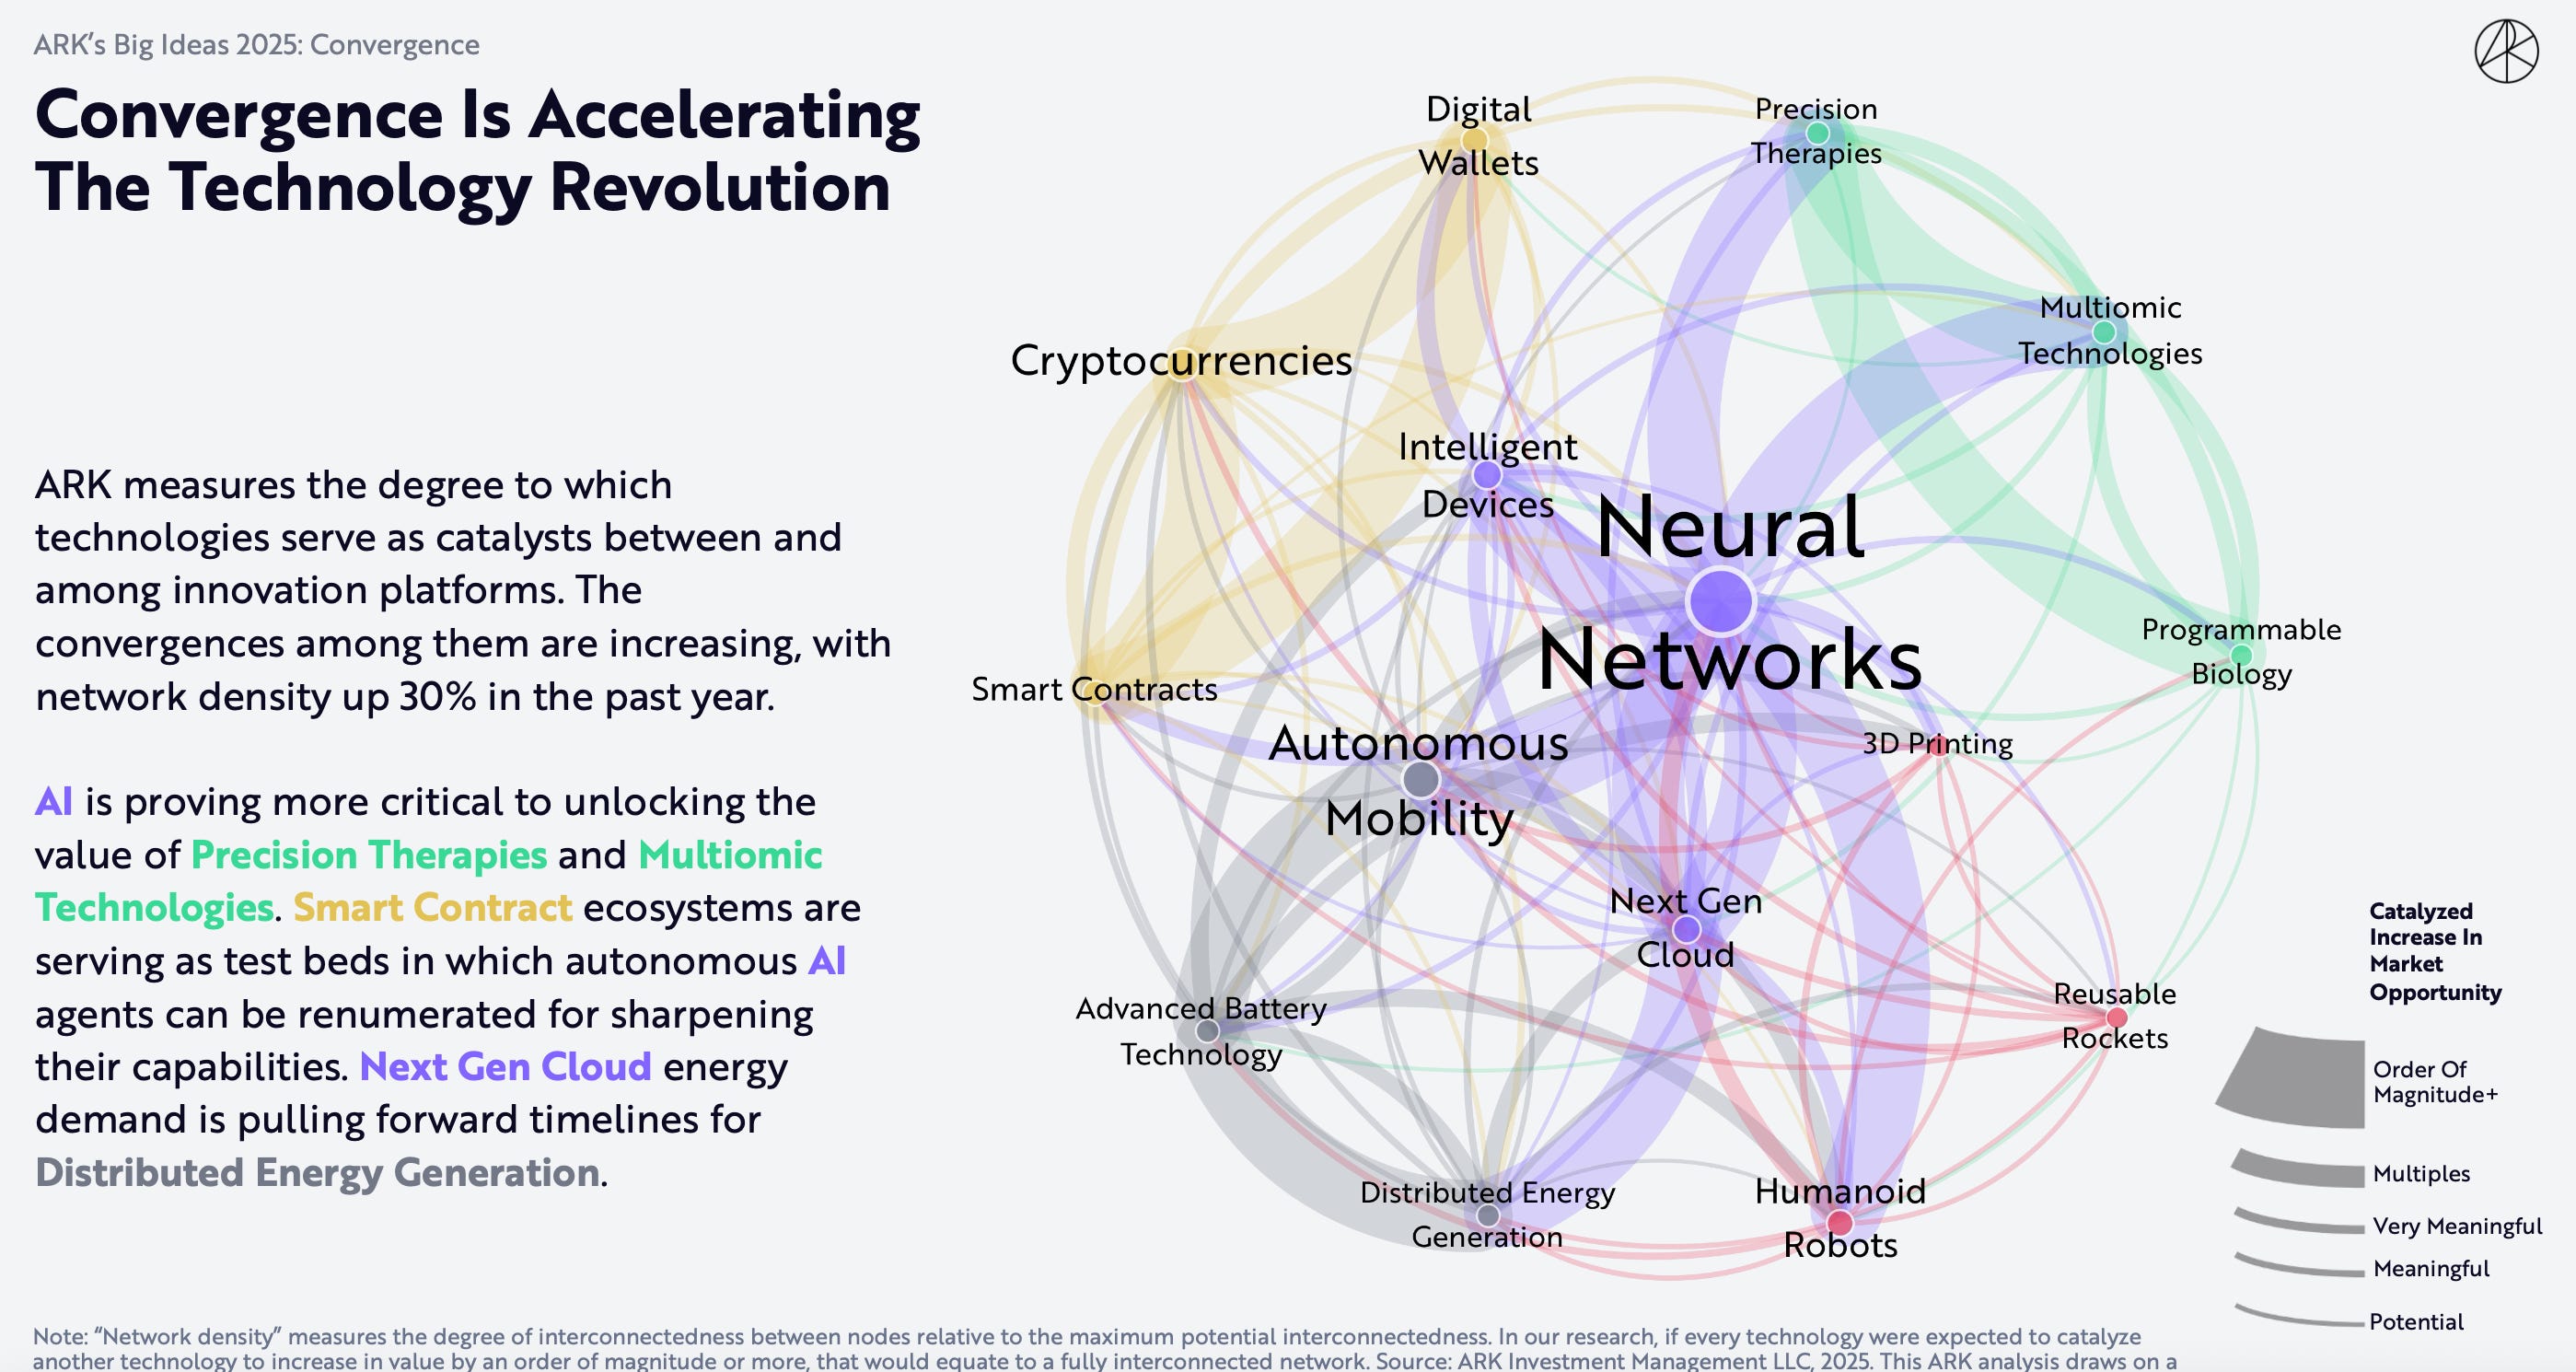
What if the ‘AI’ boom is crashing into simultaneous booms for robots, blockchains, space, robotaxis, distributed energy, internet of things, and defence? What if this is such a paradigm change we need to rebuild of everything?
This is the Kathy Wood view. We have multiple groundbreaking technologies converging at once. Maybe this is why we see the global capex #’s accelerating.
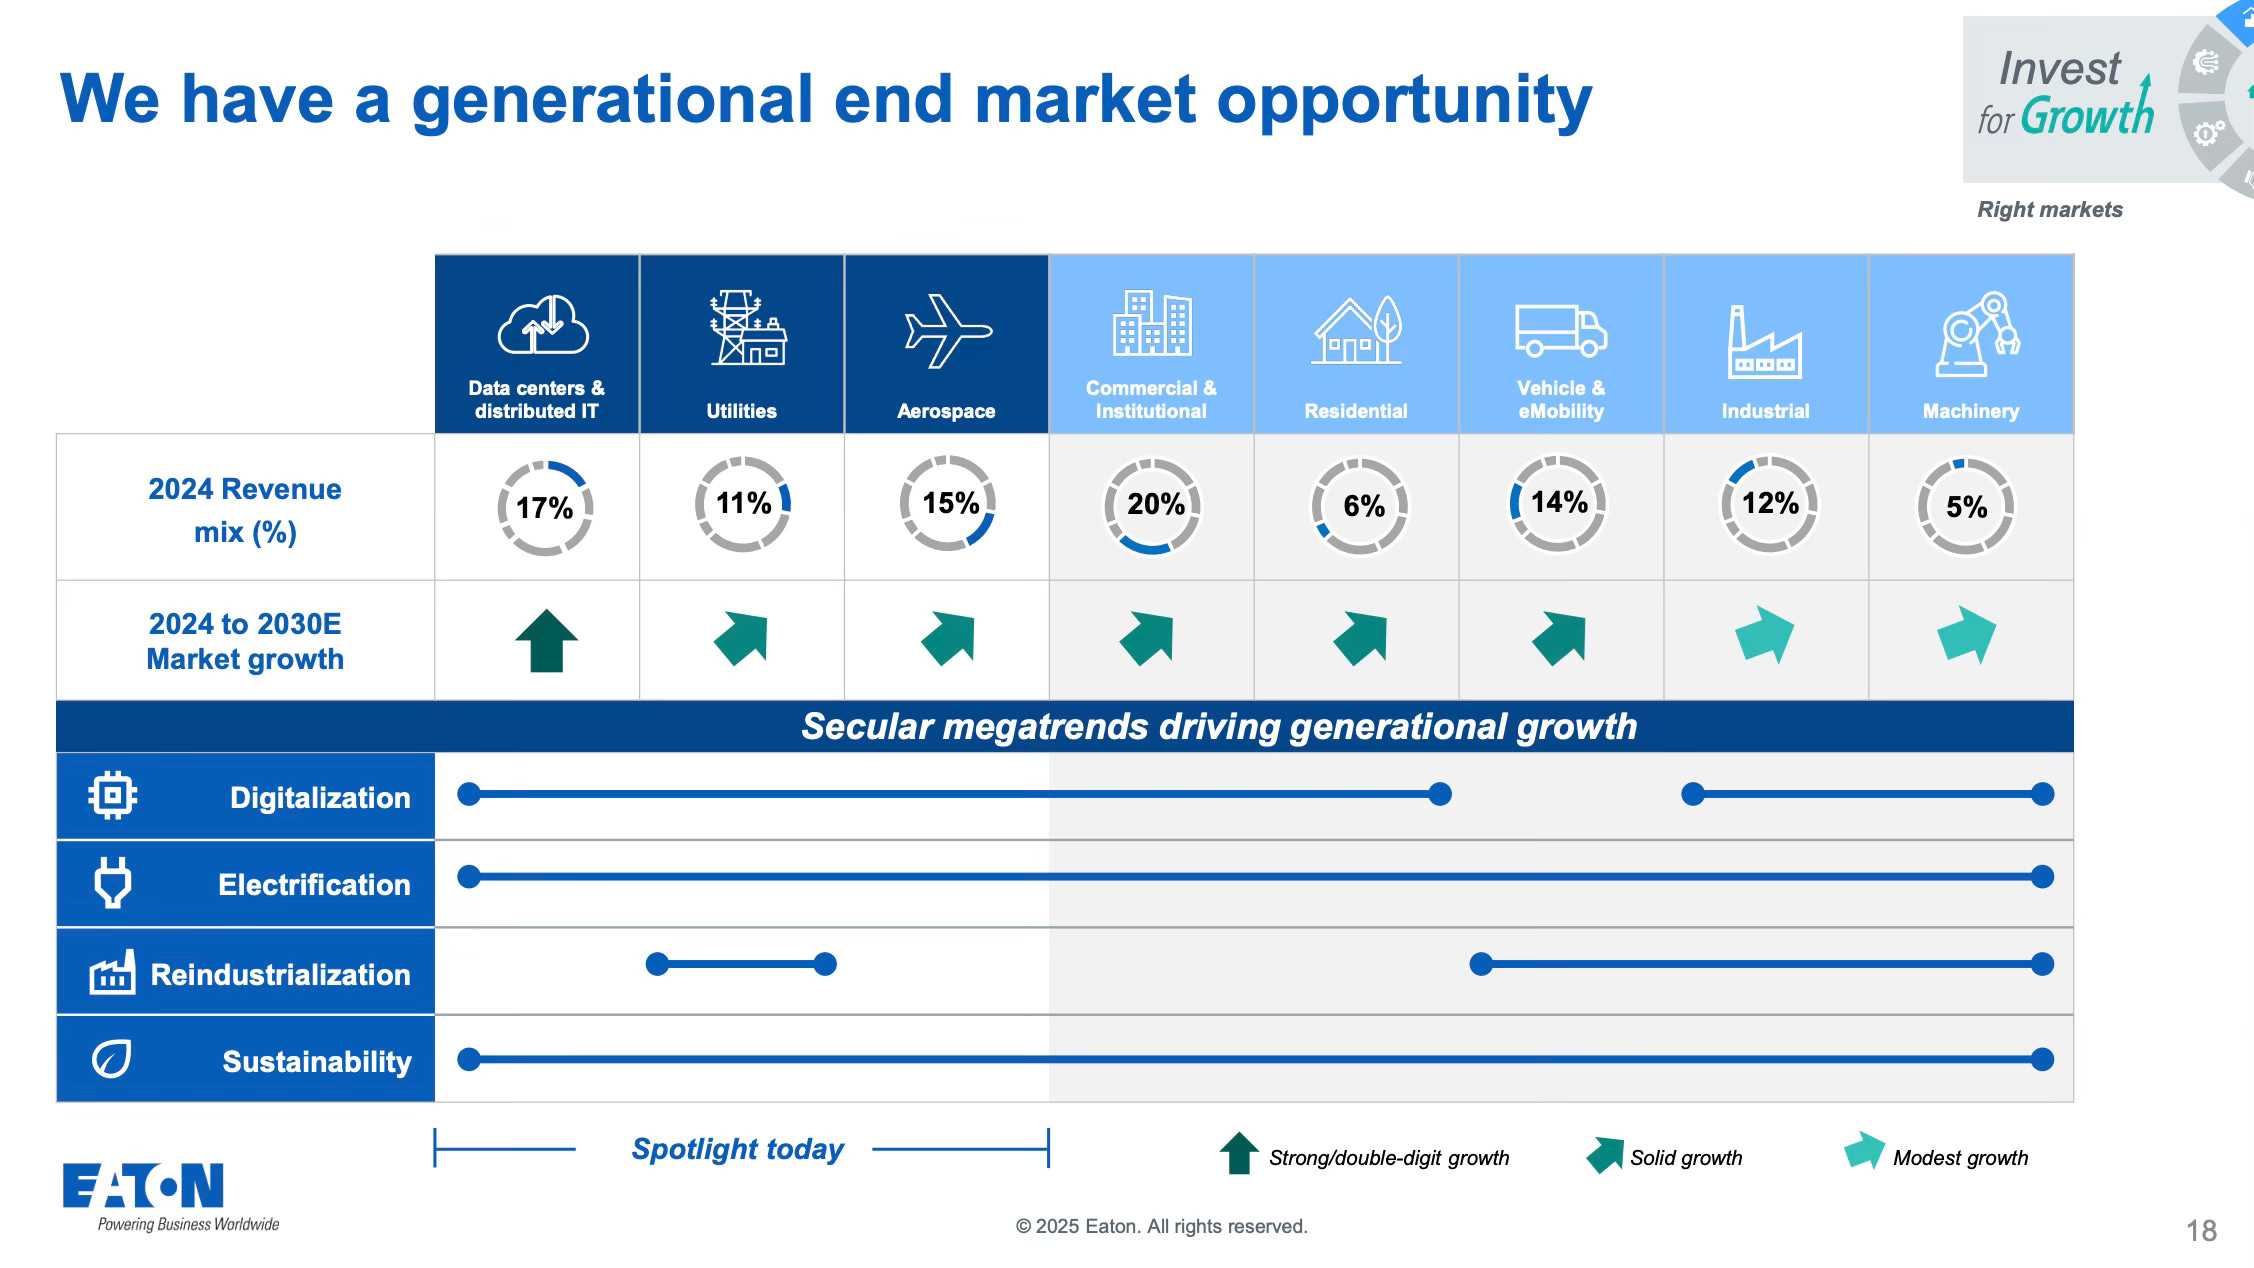
Industrial companies like Eaton are saying the same thing. They’ve never seen all their markets booming at the same time.
Data centers, utilities, aerospace, defence, mobility, industrial, machinery…
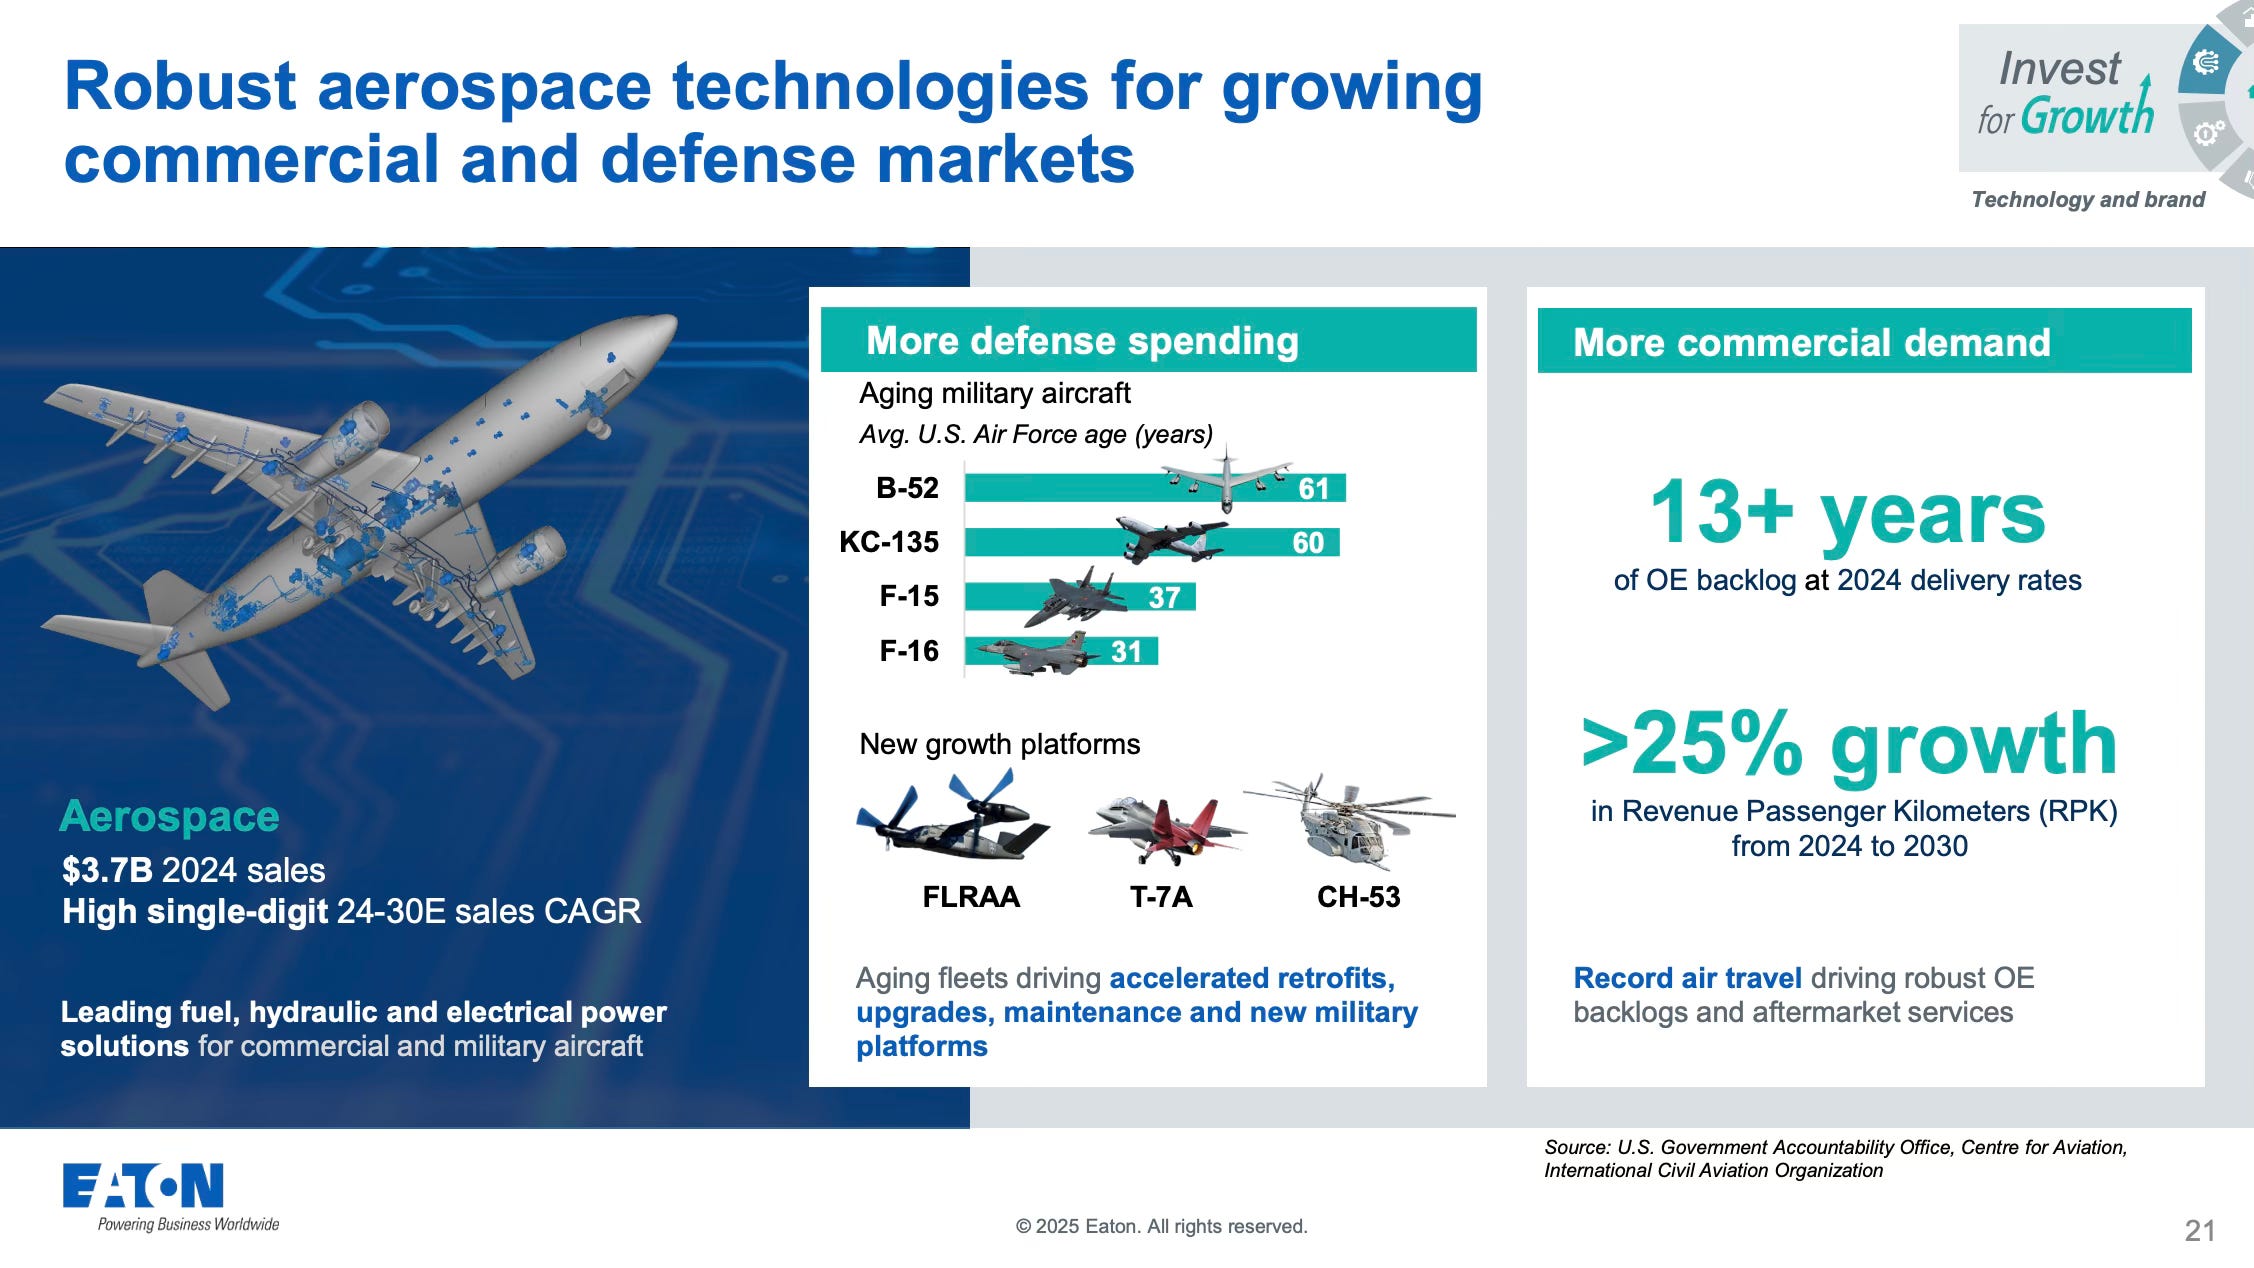
We don’t focus on the aerospace market, but that is booming too.
When do banks join the party?
We’ve been in the banks since 2022, and probably should ring the cash register. But I’ve been waiting for one final chapter in the story. A juicy chapter which is part of every good bubble story.
The bank lending boom.
Bank’s are making great profits in Japan, the US and Europe. Higher interest rates enable wider spreads and are a relief from the days of 0% to negative interest rates. Despite the improved profits banks have been cautious about the economy and not lending. The excess profits have been spent on share buybacks.
But are we about to enter the stage where banks join the party?
Post GFC the entire regulatory tone was for banks to never take risk again. It was one regulation after another. Banks were a risk to society. Bank CEO’s kept their heads down. One false move and the regulator would come in and shut you down. So they didn’t lend.
Banks delevered to get their Tier 1 ratios up and stay out of trouble.
But like all things the pendulum swings.
Now we want growth. We need jobs and we need to grow our way out of all this debt. And so I suspect the future political pressure towards banks will be to support the economy and lend. Join the party. Private credit funds can’t do all the work by themselves.
When the banks join the party we will get the next leg. It will keep the capex party going and take it to new levels.
It’s why I keep saying crazy things like S&P $10,000 and sending around Killer Wave charts.
Summary
Current levels of global capex are not extreme.
We have a tech revolution which is forcing companies to spend money or get left behind.
The ‘AI Boom’ still has more to go.
There is another shoe still to drop.
When banks join the party.
