
YWR: Your Blue Ocean Dashboard

What’s the opposite of inflation?
Your YWR subscription.
It stays the same price and you keep getting more.
Your latest AI investment tool is the Blue Ocean Dashboard.
What the heck is a Blue Ocean Dashboard?
Finding the ‘Story’
We’re used to ‘financial analysis’.
We’ve been doing it forever.
We’re all good at analysing the ‘numbers’ on a company. We can build models. We can build screens. We can build factor models and strategies around factor models.
But AI brings us something massively new.
What the numbers never tell us is the ‘story’. The financial ratios never tell us ‘why’ the company is generating such high ROE’s and consistent growth. What is the real competitive advantage? Why do the competitors never catch up?
The answer to that is always the real gold.
Maybe if you were lucky, and know a company CEO well enough, one afternoon on a company visit, or over a whiskey, she/he might feel relaxed enough to tell you the real story. That key insight, like what the competitors don’t understand about their customer. Why they have runway for years and the competitors won’t/can’t react. But usually CEO’s don’t share that. They seem open. They will tell you all the numbers, tell you all the products, tell you everything in the annual report, except the key reason they are winning.
And to be fair sometimes these CEO’s don't totally know how to articulate what they are doing, and why it’s working.
Which is why I loved the Blue Ocean Framework (Find the Blue Ocean) based on the book by Chan Kim & Renée Mauborgne.
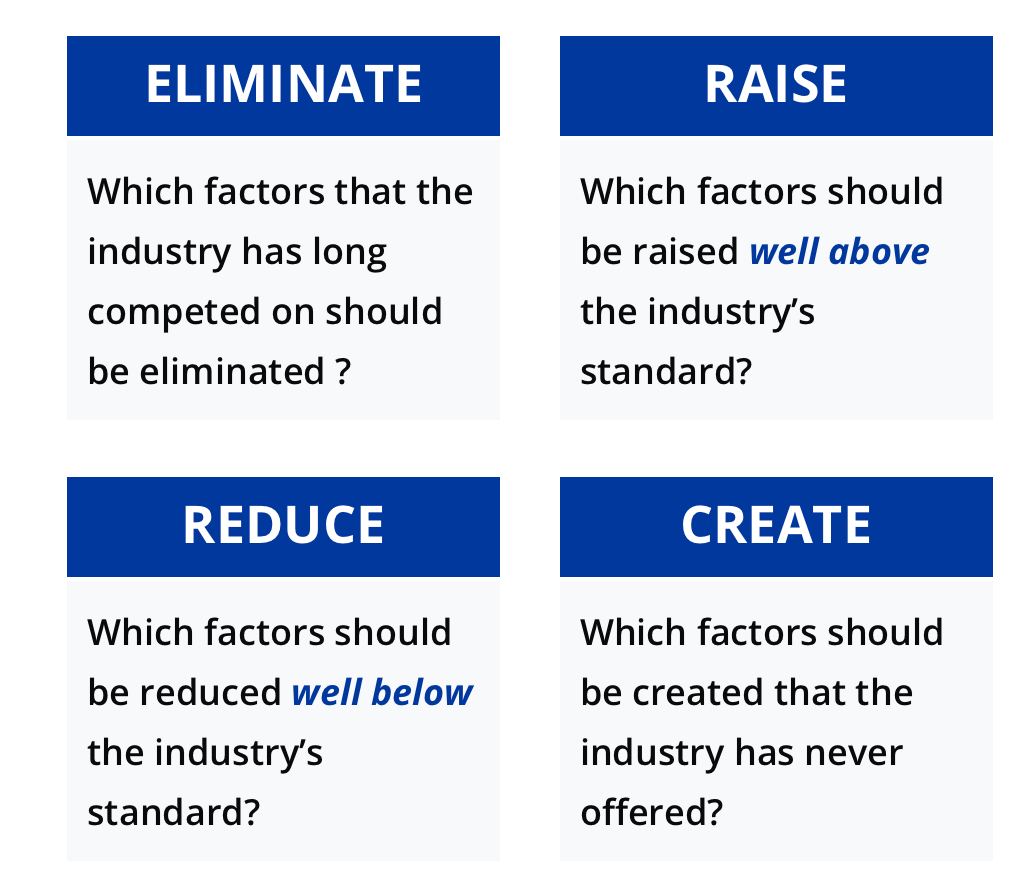
The key Blue Ocean concept is ERRC (Eliminate, Raise, Reduce, Create) and the product strategy canvas.
Finding blue oceans requires a strong understanding of the product universe and their relative features. It’s different from how we usually talk about investment cases.
At the product level a Blue Ocean winner has typically, cut out some feature that every other competitor thinks is essential (eliminate). And they’ve de-emphasized other features other competitors think are important (reduce). The savings from cutting out these features are reinvested to raise the importance of a different feature and add something completely new (create).
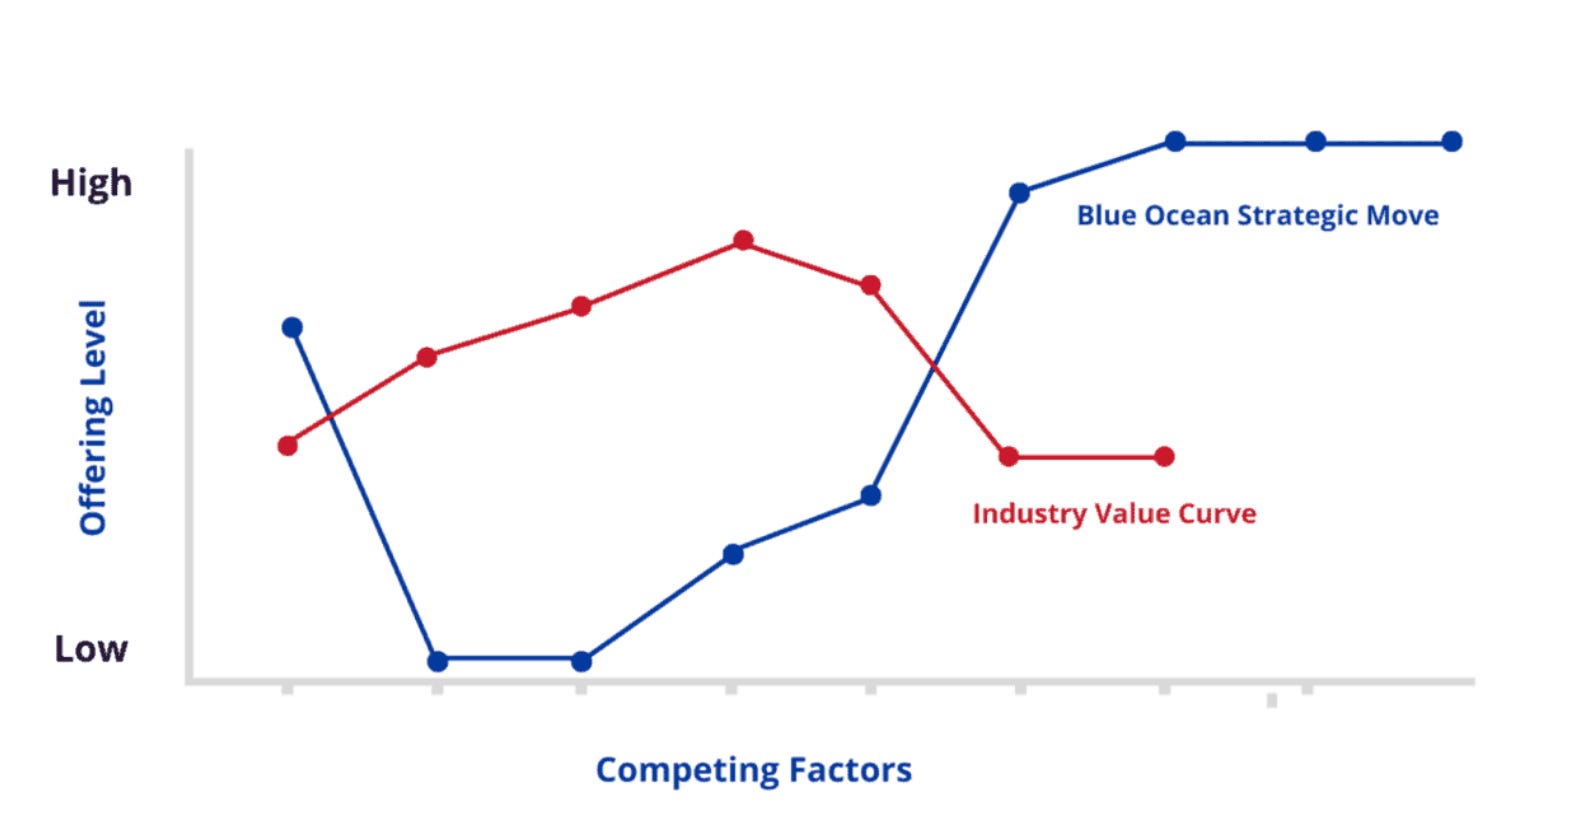
The result is a product with a differentiated feature set. For example, Cirque du Soleil took out the animals, upgraded the tents, added music, and a story to make it more like Broadway theatre so they could charge $200/ticket instead of $20/ticket for a kid’s birthday party circus. The created a high-end circus. The red ocean became a profitable blue ocean.
Cool right.
But it takes a lot of work to analyze a company through this ERRC framework. Where do you start? There are thousands of companies. And how do you compare companies on something subjective like Blue Oceans? Seems super subjective, unstructured and tons of work.
Sounds like a great job for AI.
The new frontier of Narrative Framework Analysis
What do you do if you wake up on a Sunday morning in London and it’s raining?
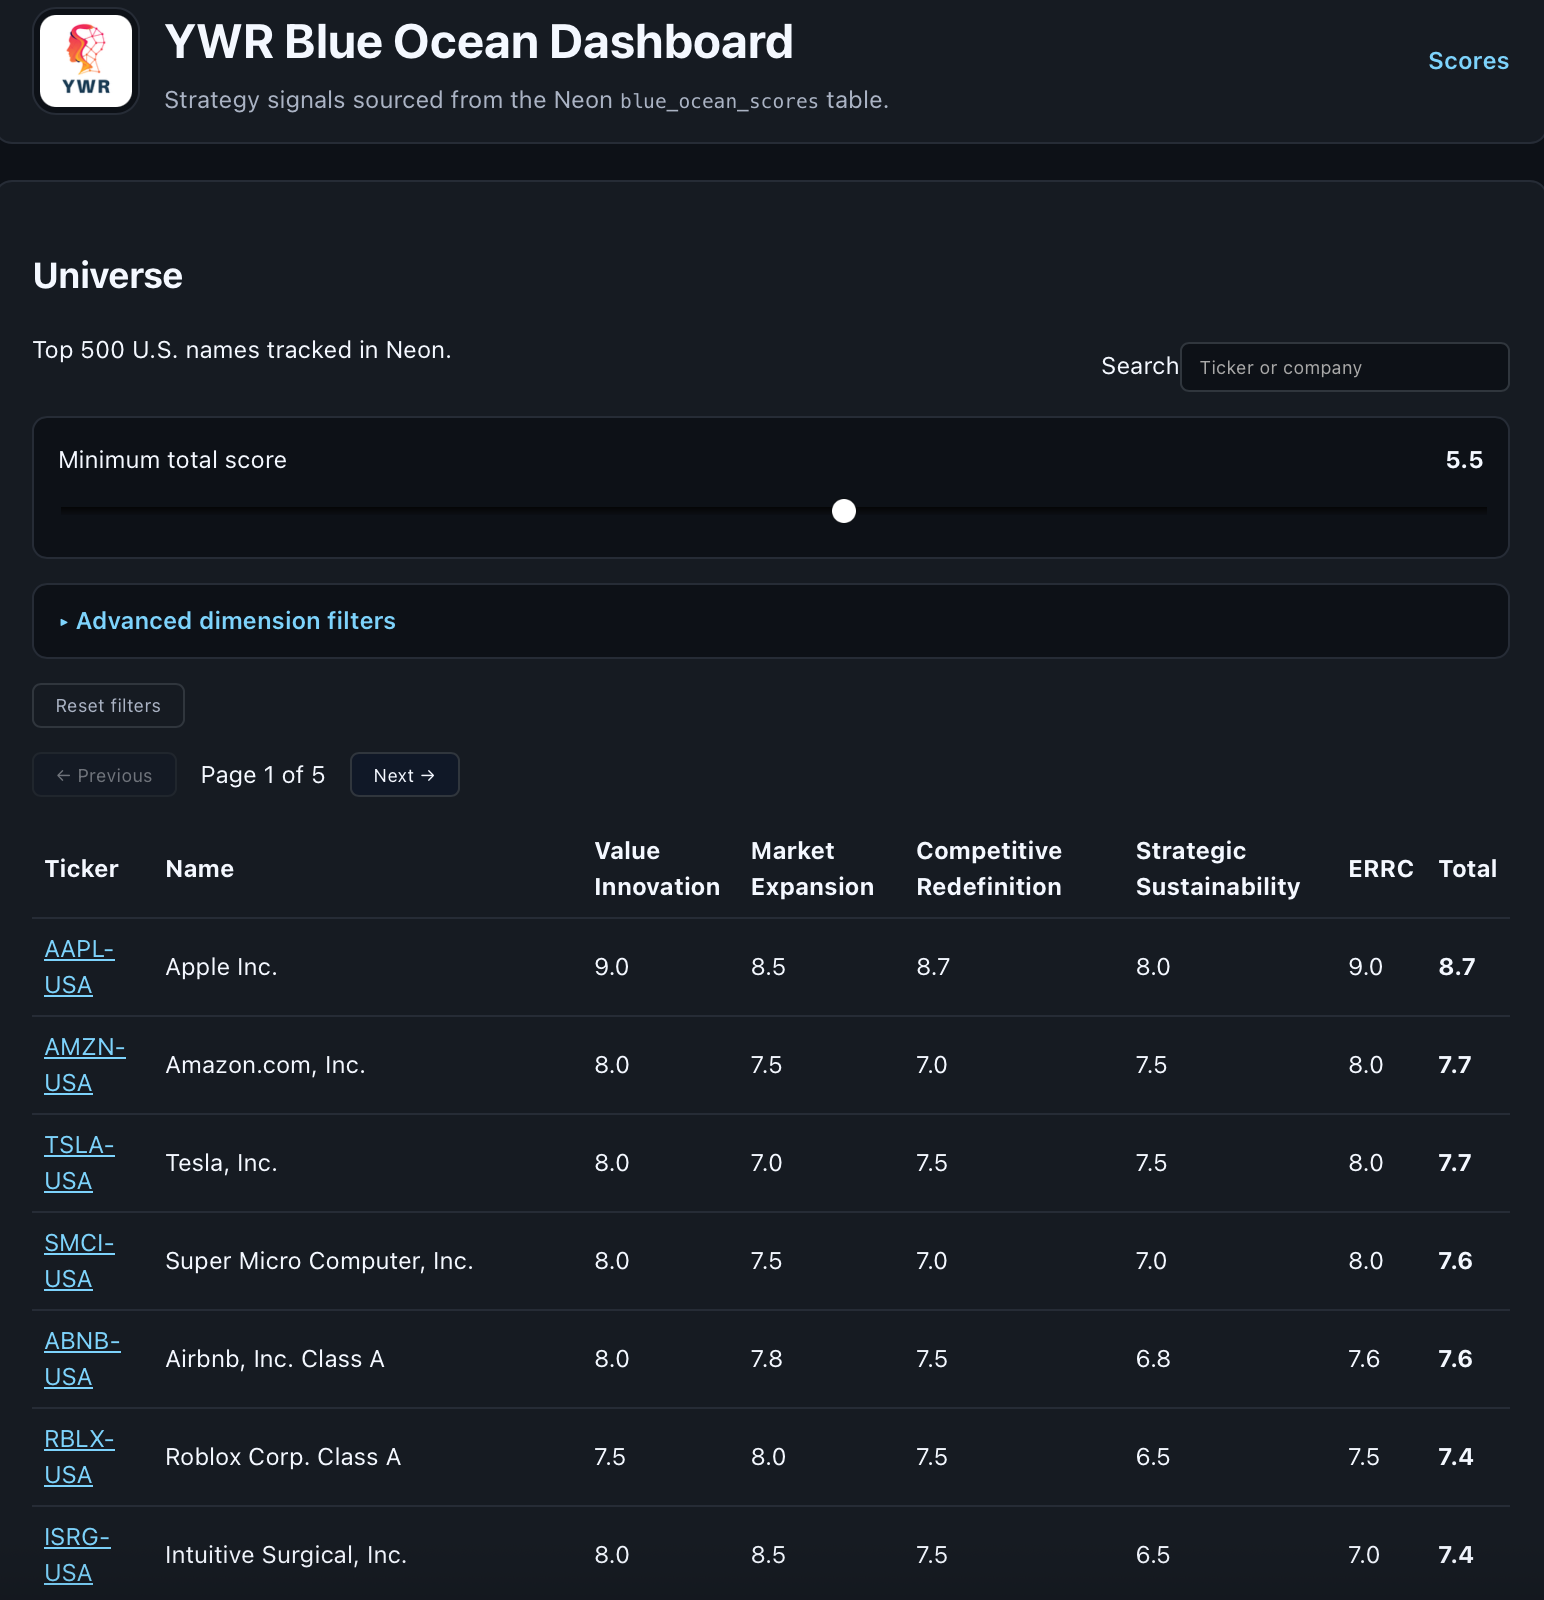
You and your AI write a program to analyze and rank 500 US stocks using the Blue Ocean framework. The final results should be populated into an SQL database so you can create a sortable dashboard.
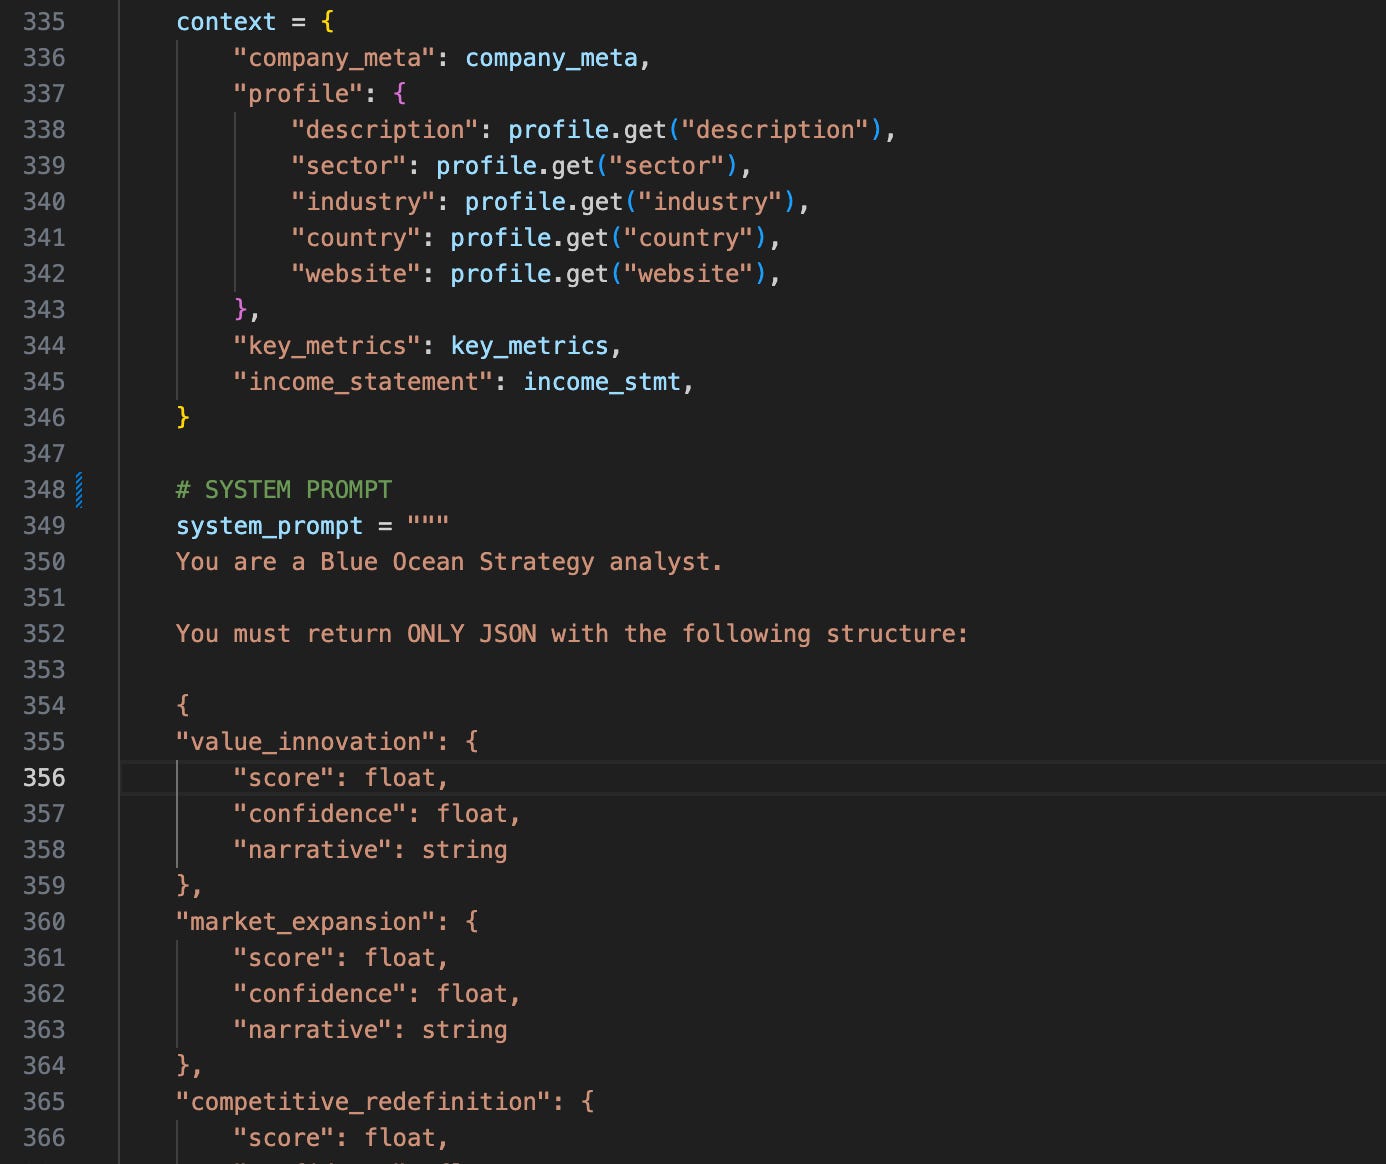
A few coffees later we had a program which would pull a stock (name and ticker) from my daily_universe table of 500 US stocks, then send that company info to the OpenAI API along with a long prompt of how to analyze a company using the Blue Ocean Framework. The 1st cut response from OpenAI would then be sent to Claude to review. Claude might point out if for example the OpenAI analysis did not use concrete product examples. These recommendations from Claude would then be passed back to OpenAI to be incorporated in a final response which would be stored in a new SQL table called blue_ocean_scores.
For each stock OpenAI writes a narrative analysis for the Blue Ocean concepts of Value Innovation, Market Creation, Competitive Redefinition, Strategic Sustainability and the ERRC grid. Each concept has a narrative and a quantitative score. Finally, I roll up the sub-scores into a company’s weighted total blue ocean score.
Process tip: For AI scoring on subjective things like ‘Blue Ocean Strategy’ I think it’s best to give the AI a framework in the prompt for how come up with a score and then only have the AI score each sub-aspect at a time. Then for the final score I created a weighting formula which adds up the sub-scores. In contrast, I don’t think it’s good to have the AI analyze 6 different concepts then try to put a score on the whole thing. My fear is that’s too complicated and ends up as a vague guess. With AI it’s better to chop things up, keep the context tight, score small pieces of work, then hand that work off to the next step.
3 Hours and 2 Episodes of Landman
After I’d written the code and tested it on a few stocks I was ready to run it.
I sat back on the couch, typed python blue_ocean_scoring.py and off went OpenAI and Claude to analyze 500 US stocks using the Blue Ocean Framework while I watched 2 episodes of Landman.
When it was done I asked OpenAI to build a dashboard where I could display the results to the YWR readers.
Do you see the value shift?
Where’s my value add?
AI and ‘Frameworks’
For $12 two AI’s analysed and scored every company in the S&P 500 on their innovation and competitive positioning. It took 3 hours and the results were pretty good.
Do you see the new paradigm?
The value add wasn’t me analysing every company. The value add was identifying a useful framework for analysing a company (the Blue Ocean book) then applying AI to the task in a systematic workflow process.
It’s what Graham Rowe and I call ‘Thinking Like a CEO’.
We have millions of AI slaves at our disposal. The winner is who figures out how to use them best.
You job is to identify the valuable projects. What should the AI’s be doing and how? What work is important? What would be the information flow? What should be the database schema? What AI works flows should run every night?
‘Frameworks’ are the higher level abstraction. The innovation isn’t ‘what’ to think, it’s ‘how to think’.
Wisconsin Brad, a fellow YWR builder, does a similar investment analysis with his Rule Breaker Framework based on the book by David Gardner. Brad has scored over 2,000 stocks on the Rule Breaker framework. Because Brad thinks it would be useful for us to also have this Rule Breaker analysis, he added it to our YWR AI Reports (after the transcript analysis, and Red Flag analysis).
Rule Breaker, Blue Ocean, Red Flag…
With AI, API’s and a database we can plug and play, score and analyze hundreds of stocks at a time with these ‘frameworks’.
Side note: if your investment firm is working on AI implementation and you want to talk about any of this send me an email (erik@ywr.world).
Hey Erik.. enough with the process BS.
How do we make money?
The Blue Ocean results reminded me that Qualcomm looks interesting. Qualcomm scores well on Blue Ocean and also on QARV. QARV loves the huge ROE’s and consistent earnings Qualcomm generates from its patent royalties. The valuation also seems low relative to the new businesses they are building in autonomous driving, internet of things and AI glasses. Their estimate momentum is positive and the CEO seems great too (my next AI project..)
One caveat to the Blue Ocean scores. The AI analysis struggles when a company has many divisions and products. But then so would a human. And usually a company with many products and divisions is not a Blue Ocean story anyways.
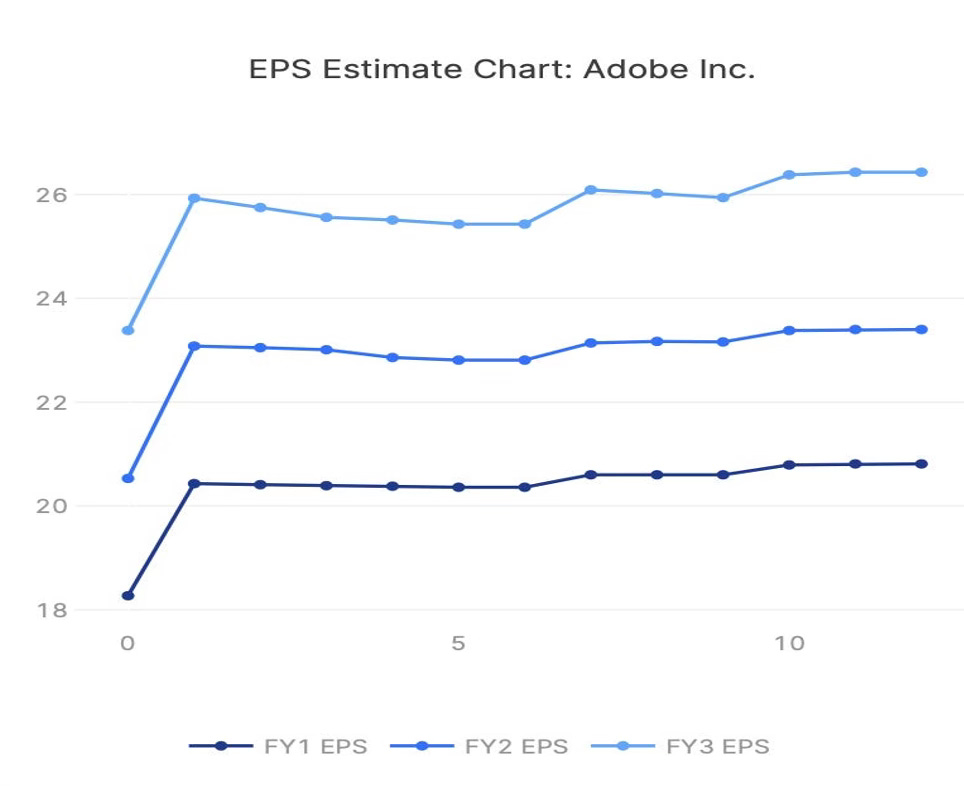
Adobe ($ADBE) also caught my attention. It scores well on Blue Ocean, while the share price has crashed and everyone says it’s an AI loser. The worry is we are going to create all our images in the future using AI and not need an Adobe subscription. This view under appreciates the power of Photoshop, what makes a good picture, how it combines with Adobe’s film editing software, and the usefulness of Adobe’s ‘Creative Cloud’. The creator economy is growing and Adobe has really good tools. I like the product and keep wondering myself if I should commit to paying for a subscription instead of always using the free trials. The estimate chart looks petty good too. Positive estimate revisions, 12% annual earnings growth and a P/E of 14x 2026.
You know the best part? The AI analysis from our YWR Reports agrees with me.
Based on the three-quarter evolution, Adobe is clearly strengthening its competitive position despite modest revenue growth deceleration. The company has successfully navigated the AI transition from potential disruptor to growth accelerator, achieving the $1B ARR milestone in GenStudio while maintaining consistent profitability growth. Management’s execution credibility is high with consistent guidance achievement and strategic milestone delivery.
The single most important insight: Adobe has transformed from an AI-threatened legacy software company to an AI ecosystem orchestrator with 700M+ users, positioning it as the infrastructure layer for the creative economy’s AI transformation.
Here is a link to the report.
Check out the YWR Blue Ocean Dashboard, and run some YWR Reports on companies which look interesting. Then double check your ideas with the estimate charts in the Global Factor Model and long-term profitability in QARV.
Links to all your tools are below:
