
YWR: New QARV Model

A new year deserves a new YWR investing tool.
Quality rankings on over 3,000 global stocks.
The previous post on QARV generated a lot of interest.
So we decided to build our own YWR QARV model and add it to the monthly datasets along with the Global Factor Model.
This post is in 2 parts.
Part 1 are thoughts on the rankings and what looks interesting. I figured you’d want to get right to the ideas.
Part 2 is a link to the full data set as well as the thinking behind the methodology.
Part 1: Top Takeaways
What looks interesting?
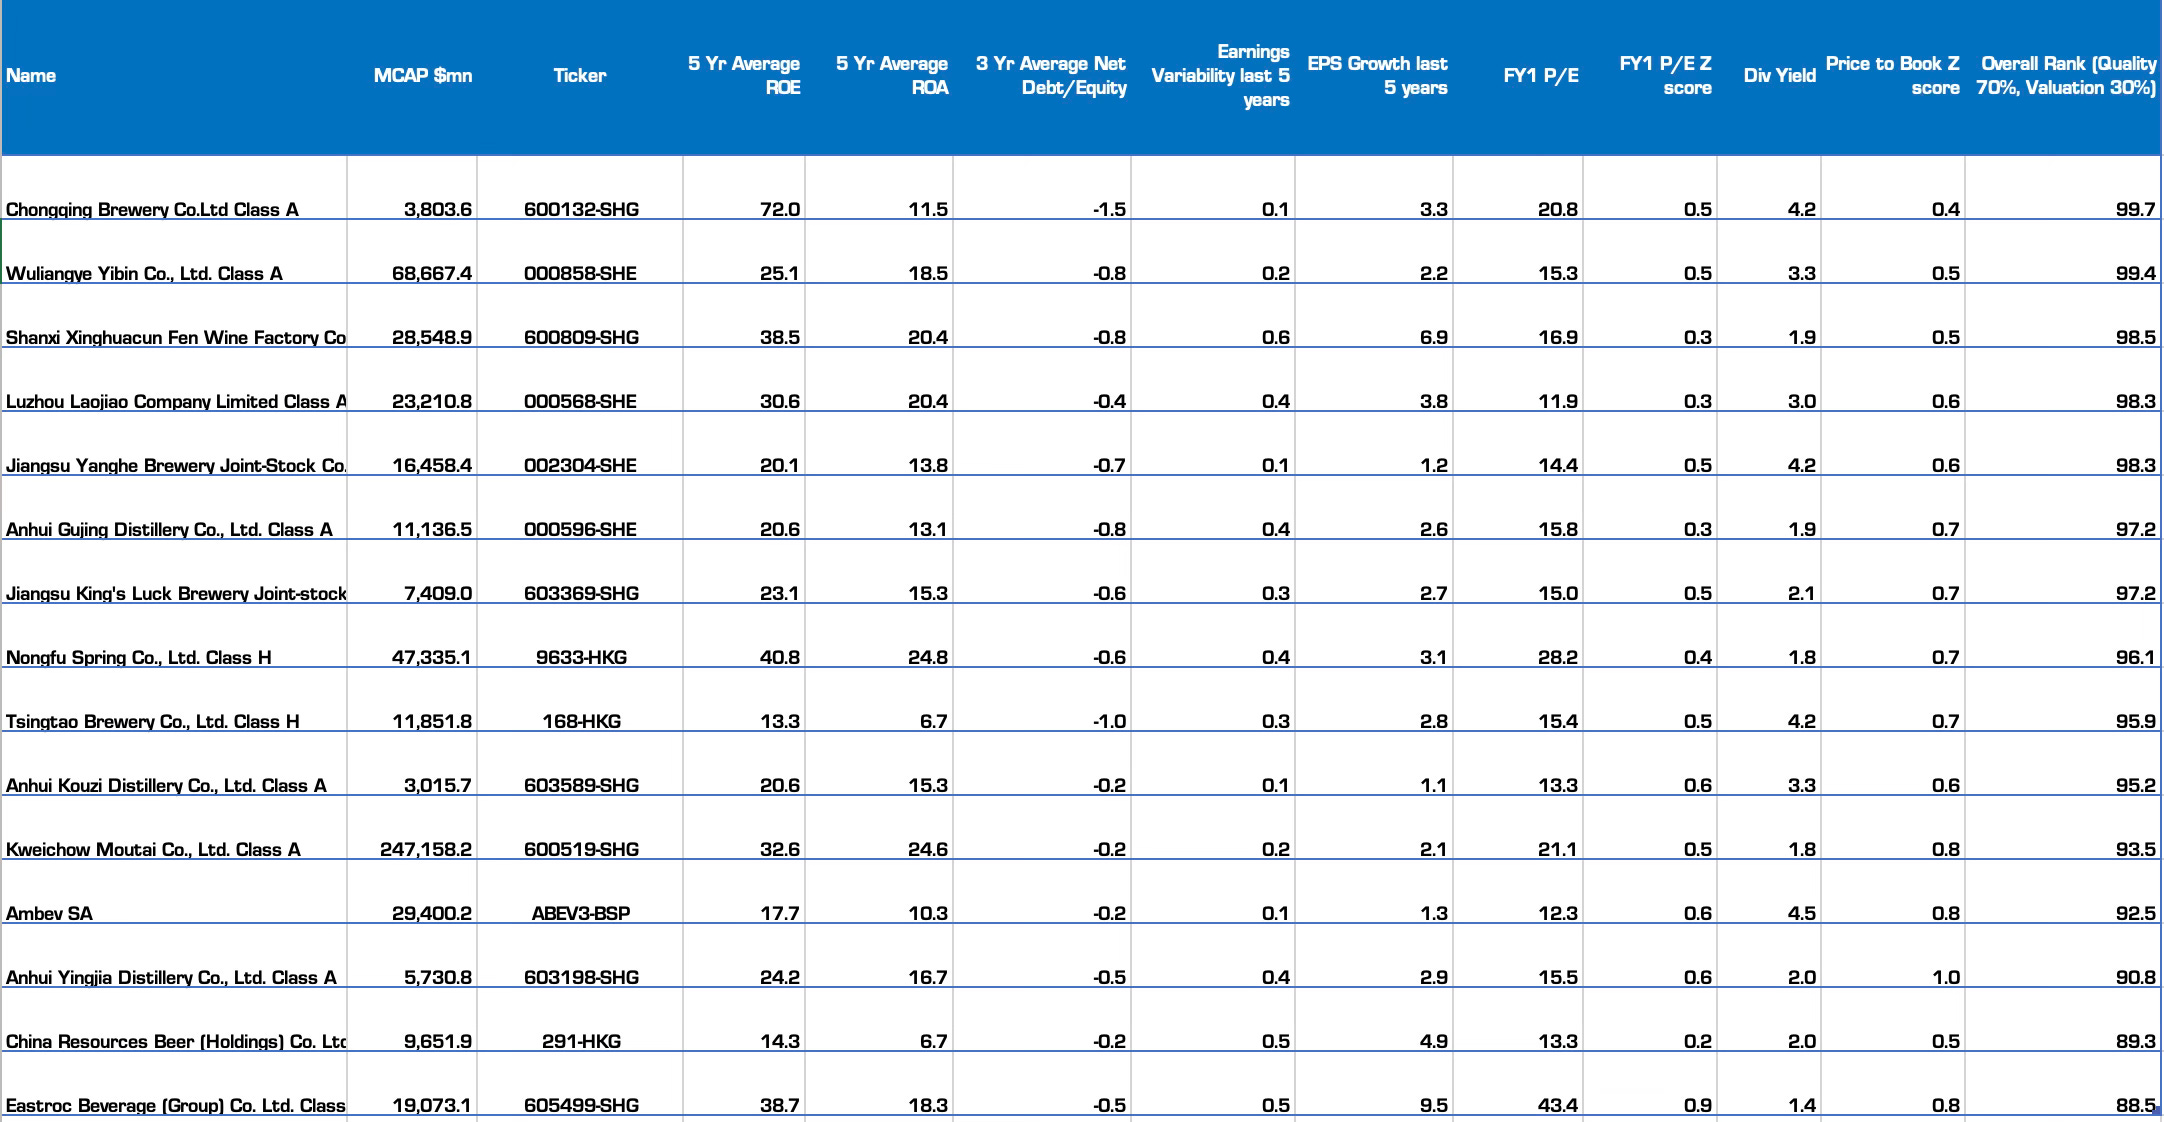
I mean what looks interesting after you scroll past the surprising number of high ROE Chinese beverage companies? Because who would ever invest in China? Right?
And after you scroll down past all the shipping companies, which nobody would ever buy either (COSCO, Maersk, Hapag-Lloyd). Right?
Then you find a high number of investment managers and exchanges (HKEX, SGX, B3, TROW, Northern Trust, Deutsche Boerse). It makes sense, and we own HKEX and SGX, but they aren’t a surprise.
What's something surprising which you would not expect to see in a screen for high 5 year ROE’s, growth, no debt, and low earnings variance?
Hint: It’s as far away from tech as you can get.
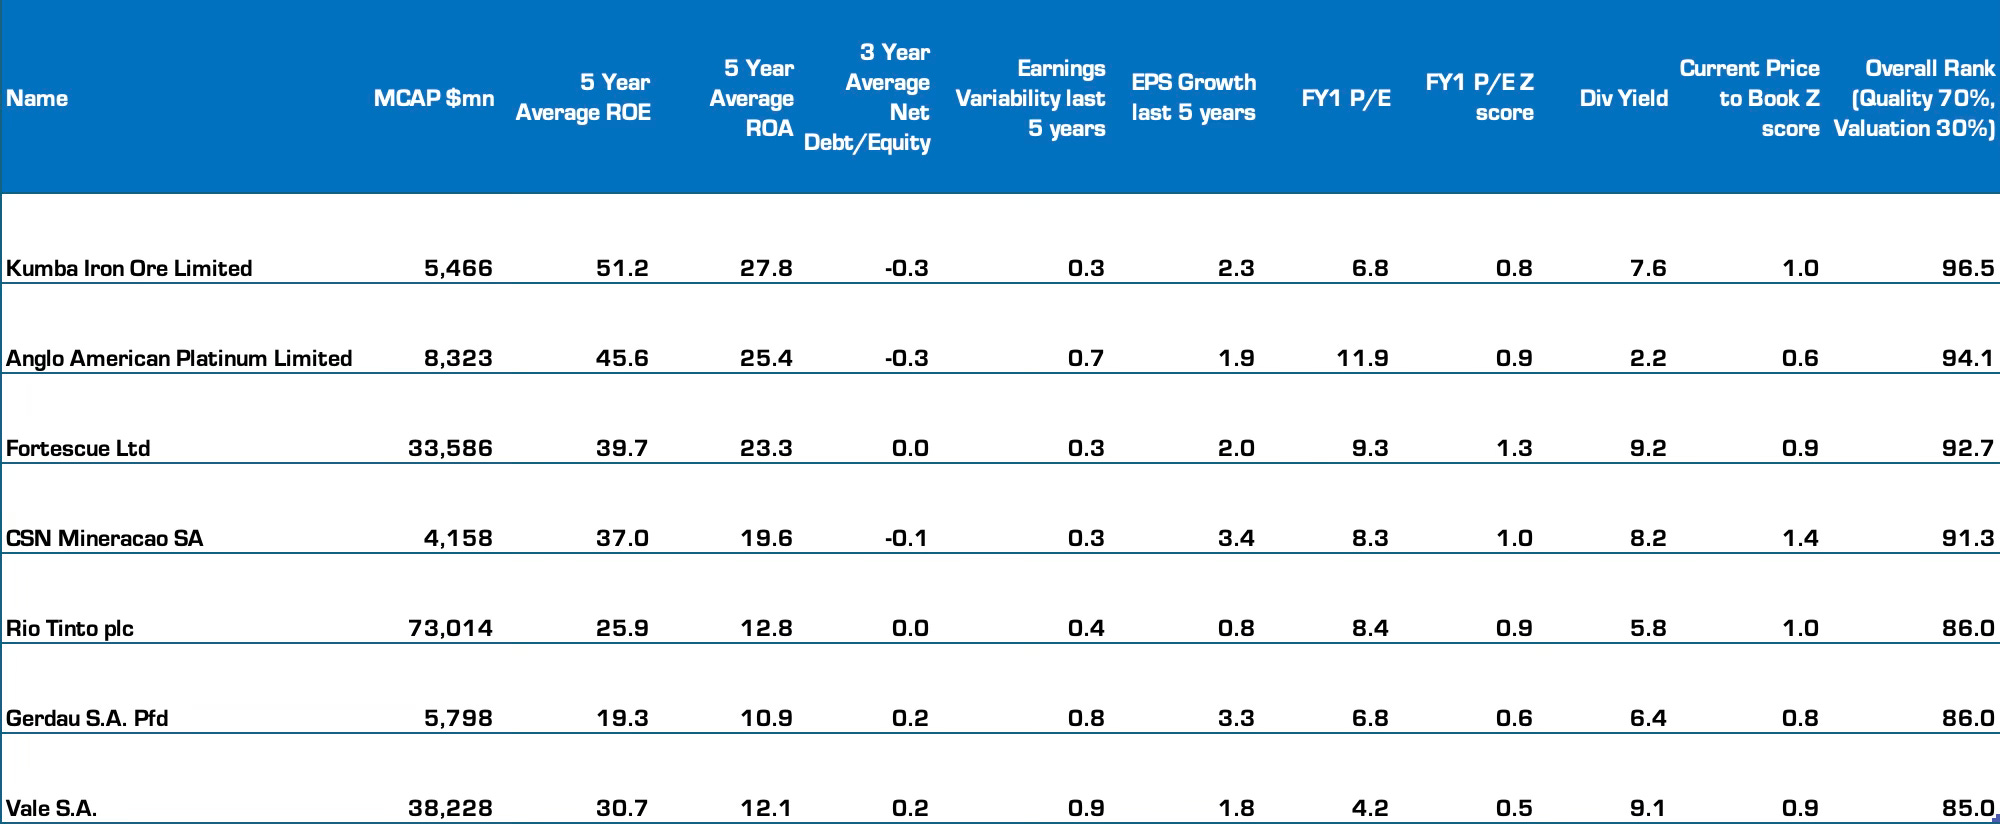
Answer: Steel and iron ore.
And it makes sense.
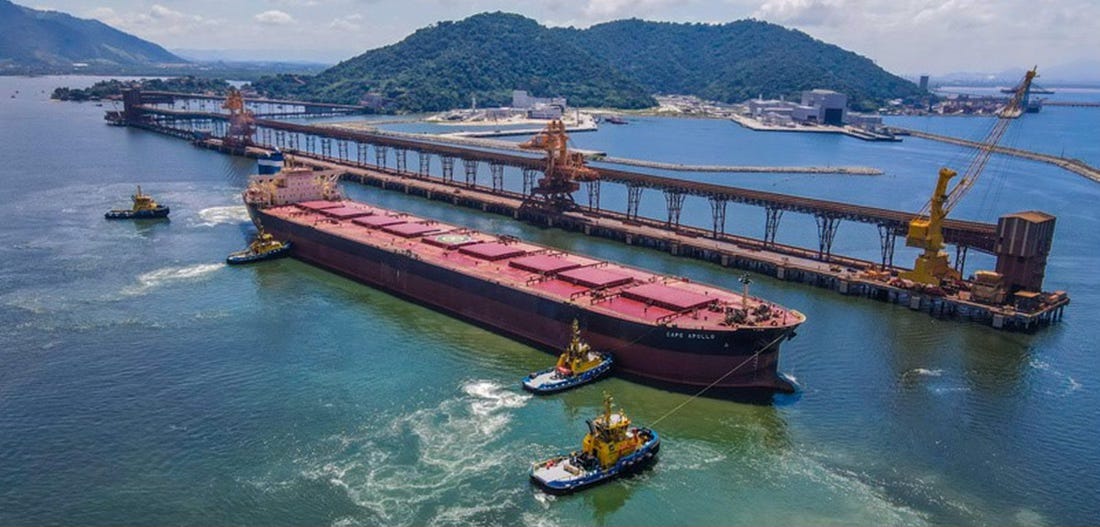
Years ago I had a realisation. I loved gold and gold mines, and dreamed of gold going to $10,000/oz, but day to day iron ore was a better business. Iron ore is global oligopoly (Rio Tinto, BHP, Vale) with high barriers to entry. Seaborne Iron Ore requires a unique combination of high grade iron ore deposits + extensive rail logistics. It’s more about logistics and infrastructure than mining. A helicopter can pick up a few thousand oz’s of gold in the middle of nowhere. Millions of tons of iron ore is a different game. And good iron ore deposits last for decades.
Investors are persistently negative on iron ore and steel. They always expect it to crash and burn, especially with an epic Chinese property crash underway, but the numbers say these companies are cranking out the ROE’s, have no debt and get no investor credit for their profitability and cash flows.
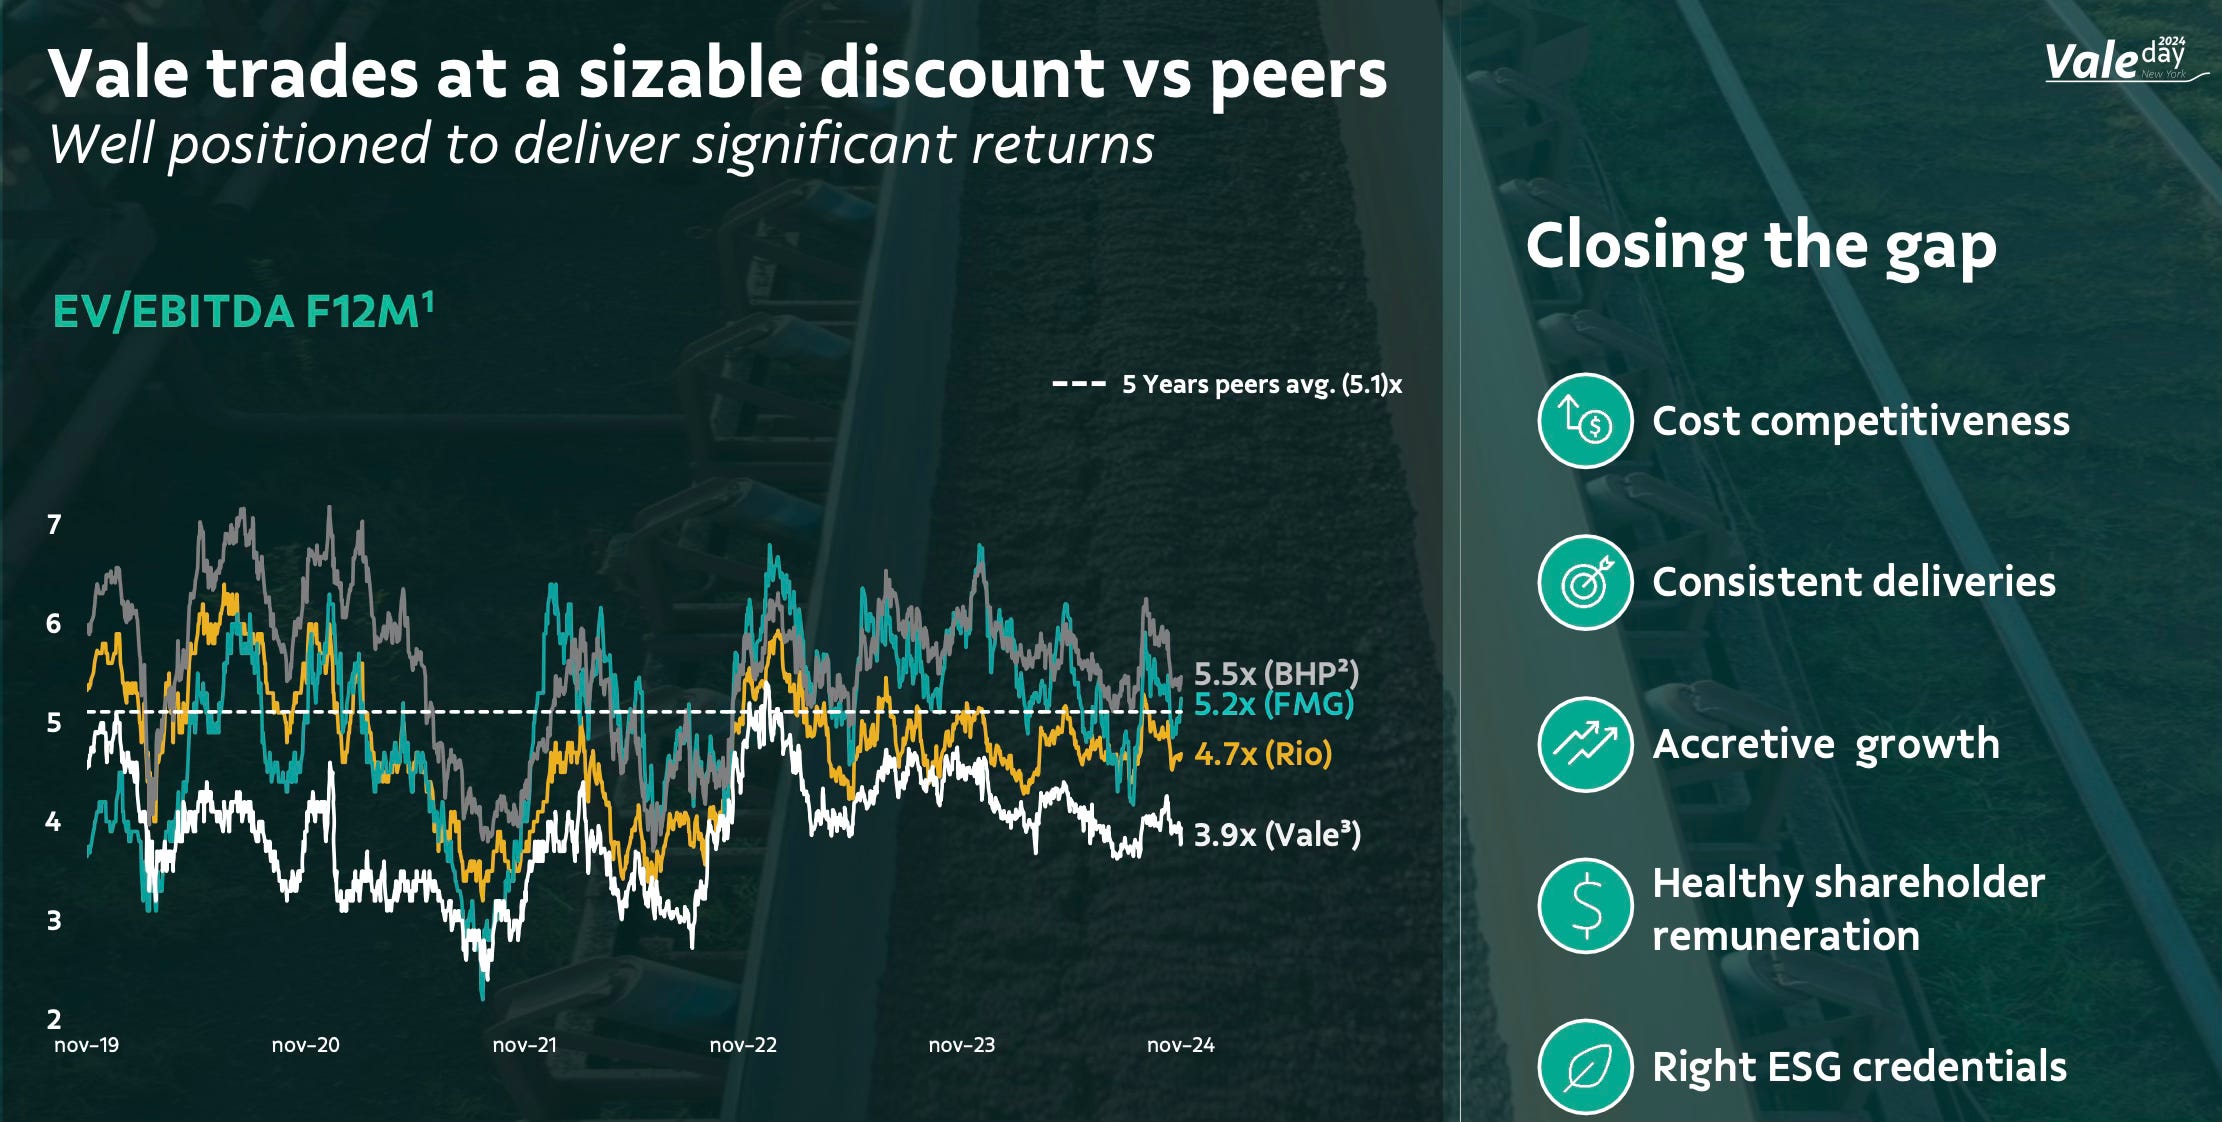
Vale looks particularly interesting.
Important disclosure. These rankings are just to generate ideas. Do your own due diligence and make sure the data is correct and what you are looking for.
Part 2: The QARV Data and how it works.
First, here’s a link to the data on over 3,000 stocks as of January 9th. It’s also on www.ywr.world in a tab along with the Factor Model Data (Global Factor & QARV).
