YWR: Global Factor Model
Do you feel like everyone is rehashing the same themes over and over again?
Are you getting bored?
I know. Me too.
That’s why we review the global factor model every month.
We check the earnings revisions globally and identify new trends around the world.
Every month we scour the data to find the new, new.
Doesn’t mean we have to invest in every theme. We just want to be on top of what’s going on.
It’s our situational awareness.
At the bottom of the post are links to:
Global factor model rankings on over 3,000 stocks.
Retool data app with earnings momentum charts for each stock.
Tableau dashboard with estimate/momentum scatter plot.
Now let’s get into it, starting with the top 30.
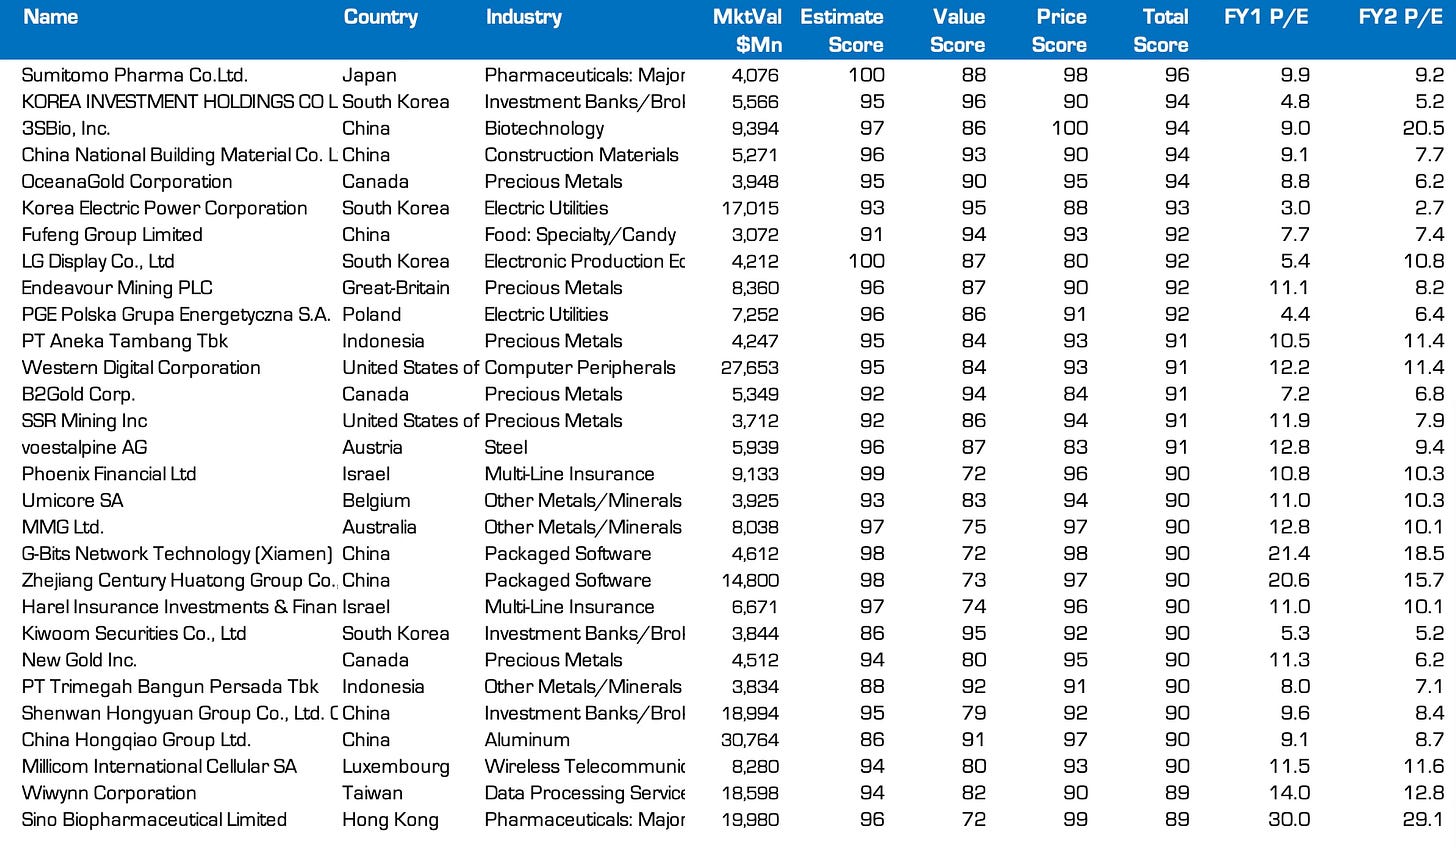
The YWR Top 30
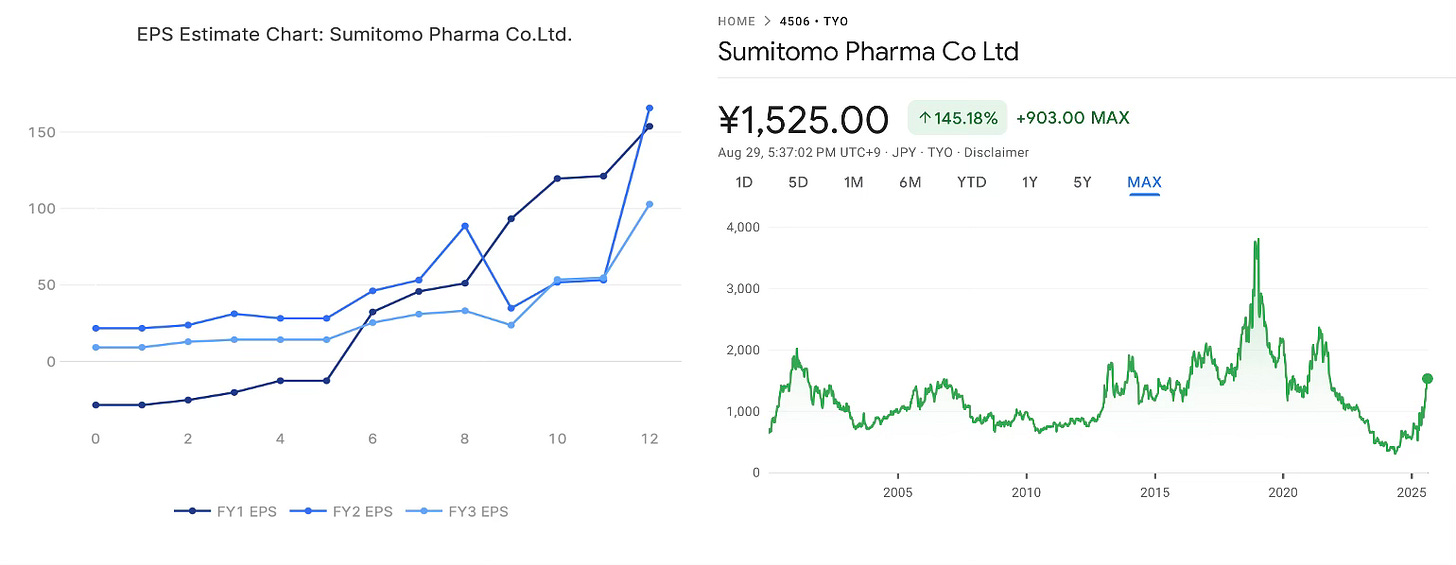
If I was a computer I would love Sumitomo Pharma. Look at these earnings revisions and a valuation at 9x 2026E. The problem is my human side struggles with pharma stocks. My strength is financials. But maybe you are better with them.
What else do we see?
Korean stocks. We love Korea. This has been a great theme for us and you got in on the absolute lows in December (Who am I ETF?). Good job.
KEPCO ($KEP) reports result on Sept 8th. As a reminder they have both raised electricity tariffs (after not raising them during COVID), while coal prices have fallen, so profitability has exploded. It’s trading on a P/E of 3x. Investors aren’t sure if these margins are the new normal or they will get rug pulled by the government. The bull case is the government knows KEPCO needs to be profitable and investing if South Korea is going to lead in AI, and futuristic industries. I don’t own it, but if this goes +100% from here I know I’m going to feel really stupid.
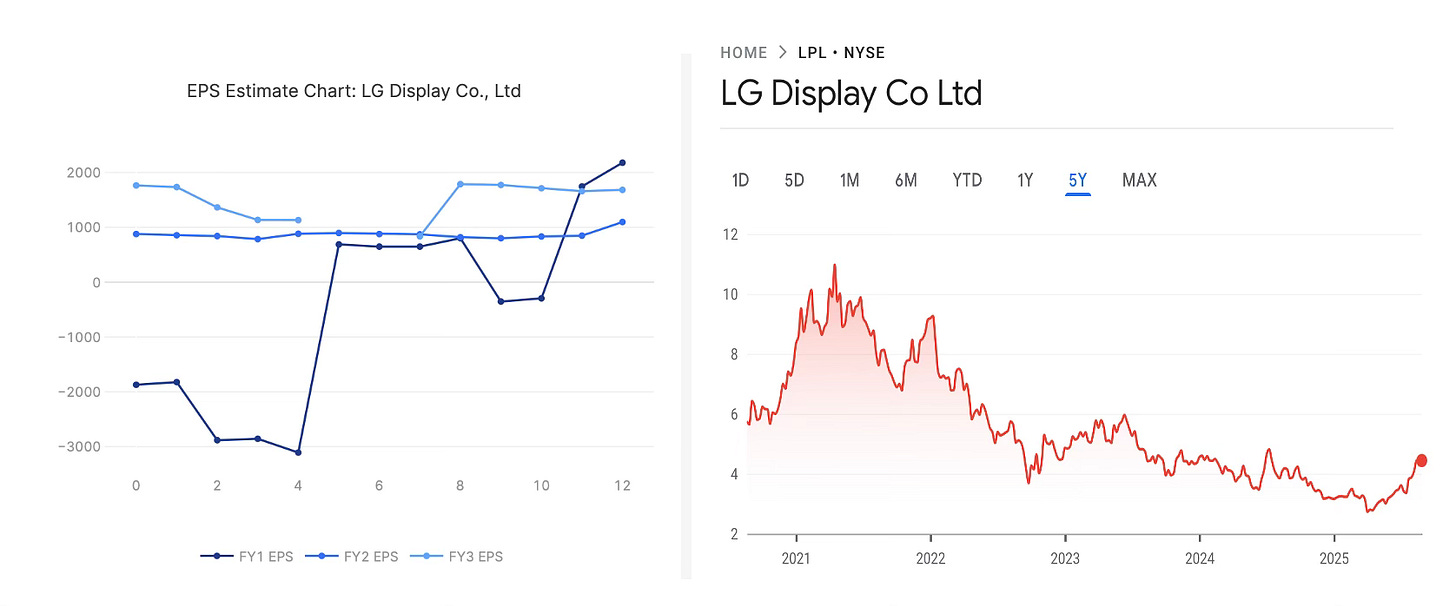
LG Display ($LPL) is worth mentioning. The business is barely profitable and has struggled for years. But it catches my attention when a stock with a chart like this shows up in the Top 30 globally for earnings revisions, valuation and price momentum. Or, maybe it’s just noise.
The bull market in Memory.
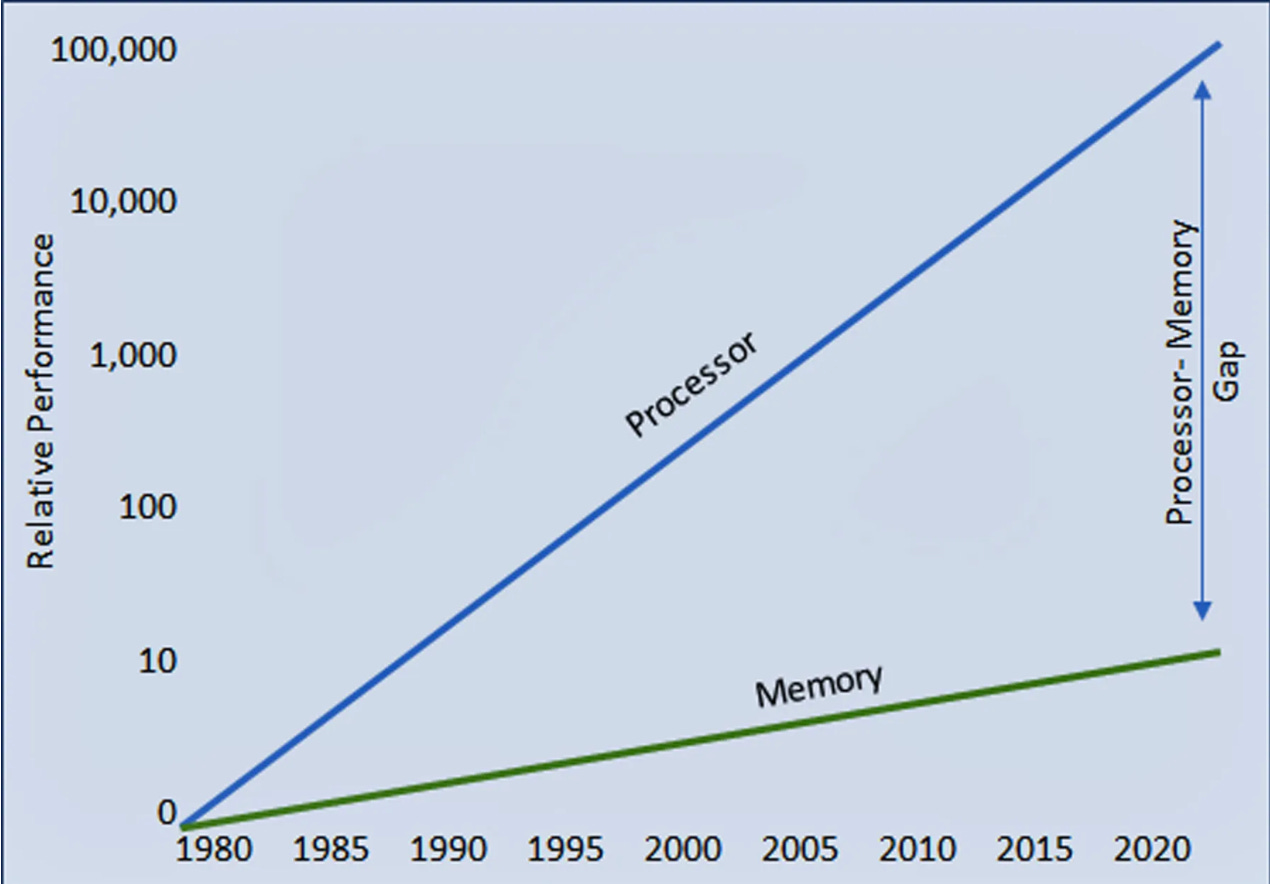
In Would you be interested in Nvidia on 7x we learned about the ‘memory bottleneck’. The bottleneck is that GPU speeds have massively outpaced memory speed. Consequently, attention and spending is shifting to high end memory solutions. Memory is hot.
Cloud spend on memory is rising, but there is also an upgrade cycle in new AI configured laptops and smartphones. Even basic memory products are benefitting. And so we see Western Digital ($WDC), SK Hynix and Sandisk ($SNDK) all scoring well in the factor model. NetApp ($NTAP) is another memory/storage play which scores well. Jensen says the entire technology stack needs to be redesigned for AI (Nvidia GTC Keynote starting at 1:50) and storage is a big part of that, which is interesting, because memory is not a sector investors talk about as much.
The Bull Market in Chinese Brokers
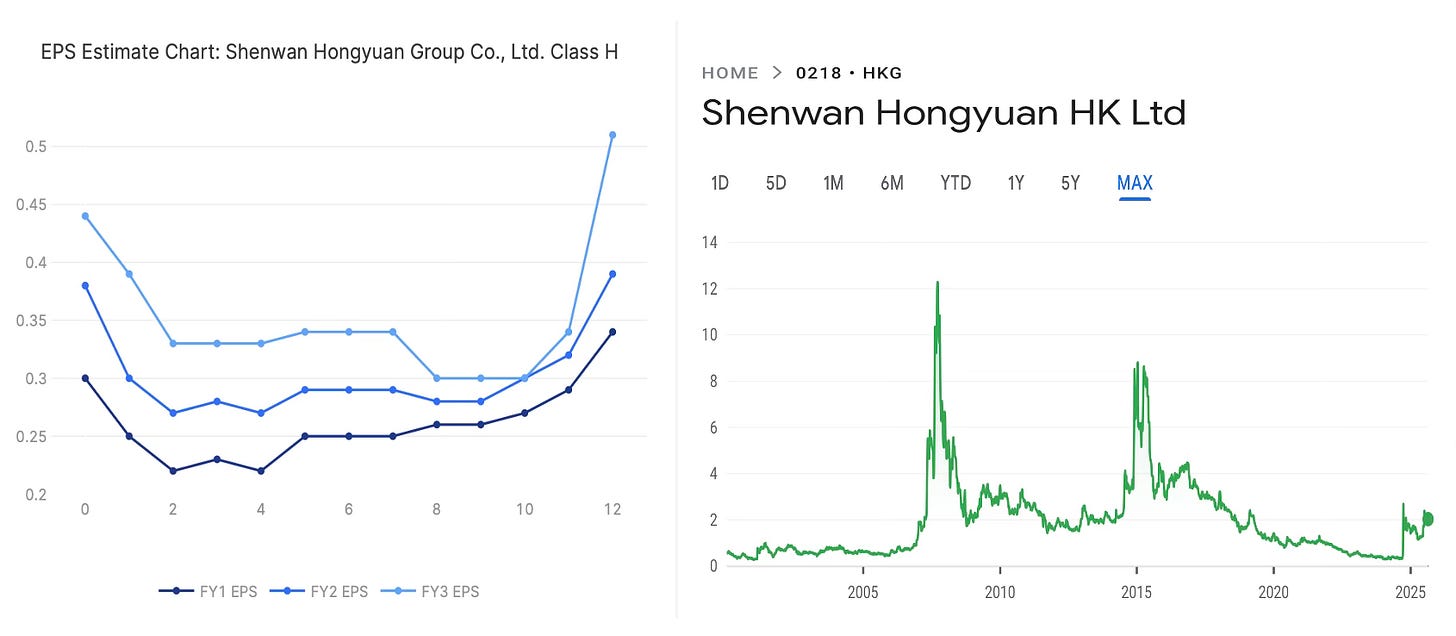
Everyone is talking about AI. But is the real bull market we should be talking about Chinese stock brokers? I’ve never heard of Shenwan Hongyuan, but the FY3 estimate is HK 0.5/share and the stock is trading at HK$ 2. Does it go to HK$ 5? If hundreds of billions of dollars parked in HK bank accounts is going to flood into the Chinese stock market aren’t these local brokers a great way to play it (aside from HKEX: YWR Portfolios)?
Do brokers like Shenwan make a new all time high?
Please filter the Global Factor Ranking sheet and the Retool Data App to make a list of HK listed brokers, because there are many.
A set up in fertiliser stocks?
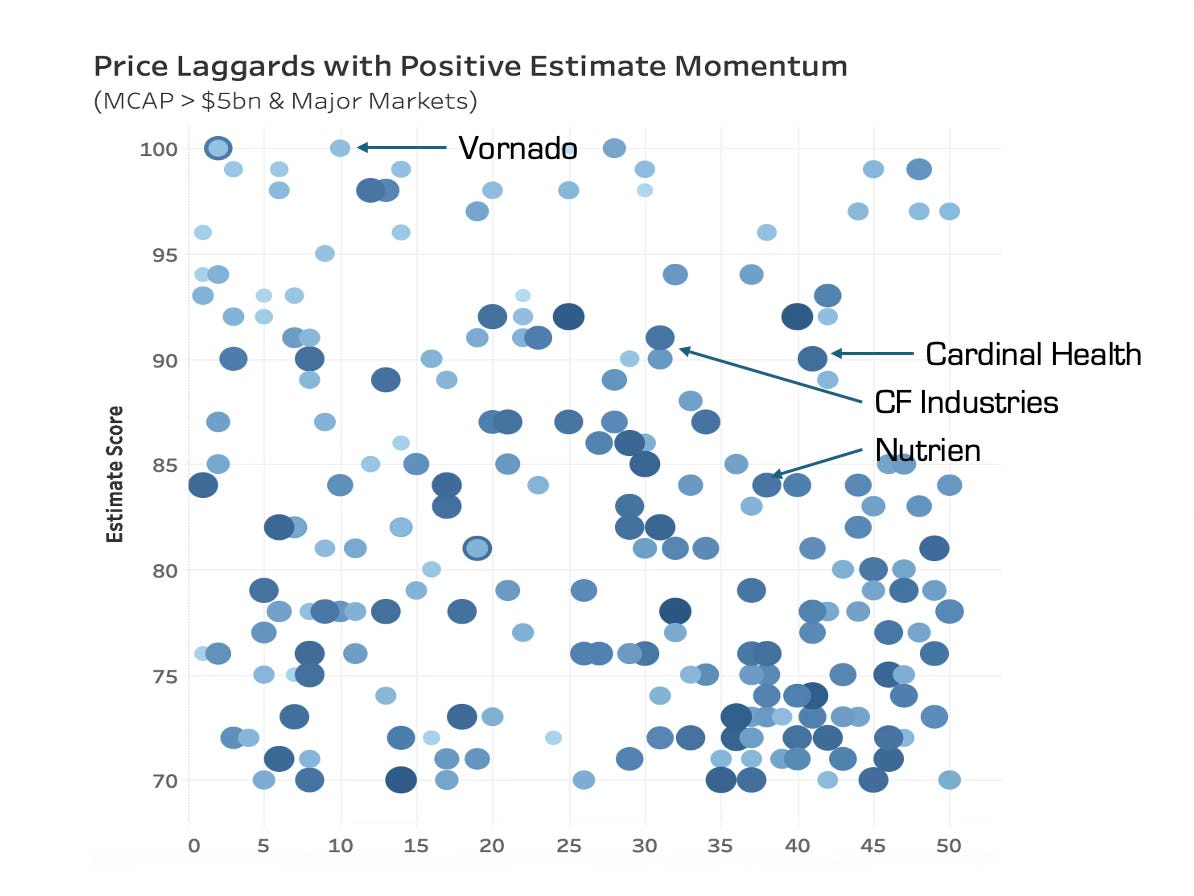
A favorite tool of the YWR Tableau dashboard is the interactive scatterplot of stocks with high estimate momentum and low price momentum. This is meant to capture stocks where estimates are rising, but there hasn’t been a big move yet in price. We are looking for interesting set ups.
When I was looking through this month’s scatter plot CF Industries ($CF) and Nutrien ($NTR) stood out. Positive earnings revisions but the share prices haven’t moved.
Last month I highlighted that REIT’s like Vornado could be interesting if interest rates are about to fall. Real Estate ranks right next to Energy on the list of most hated sectors.
Industry Level Trends
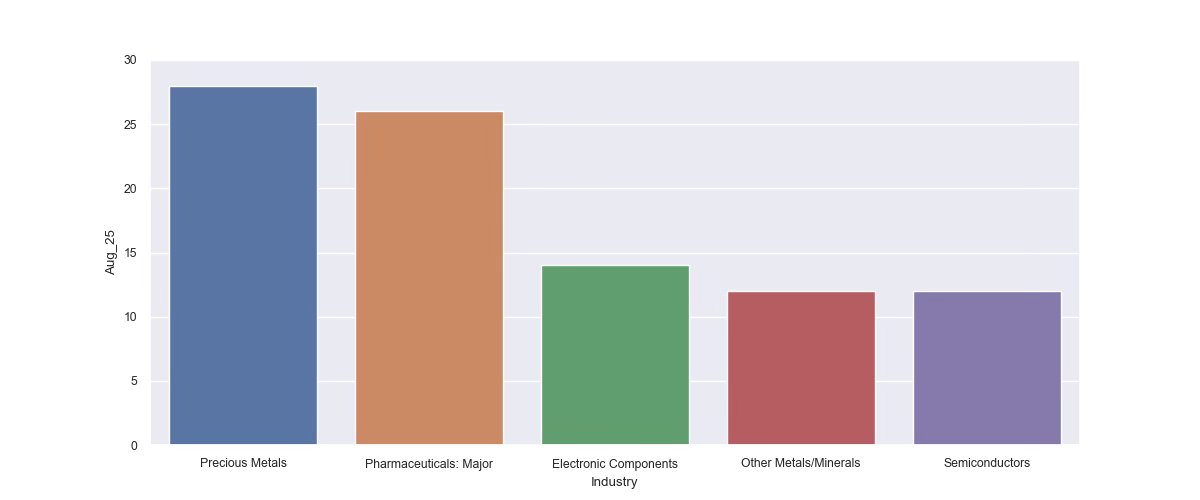
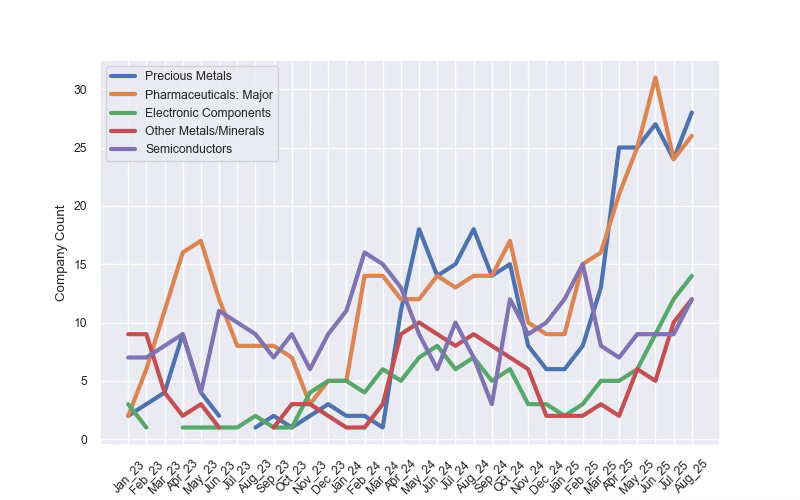
I feel pretty good that we’re on top of all the industry level trends, except for Pharmaceuticals. We are bullish on gold. We get that hardware is the new software. We understand the bull market in the Taiwanese supply chain. But it bothers me that Pharma is doing well and I just don’t have any conviction about it. And the fact that nobody ever talks about it makes it even more interesting.
Again, look at the monthly chart. Everyone talks about gold miners, but nobody talks about mid-cap pharma companies. Also notable that banks are no longer in the Top 5.
Country level trends
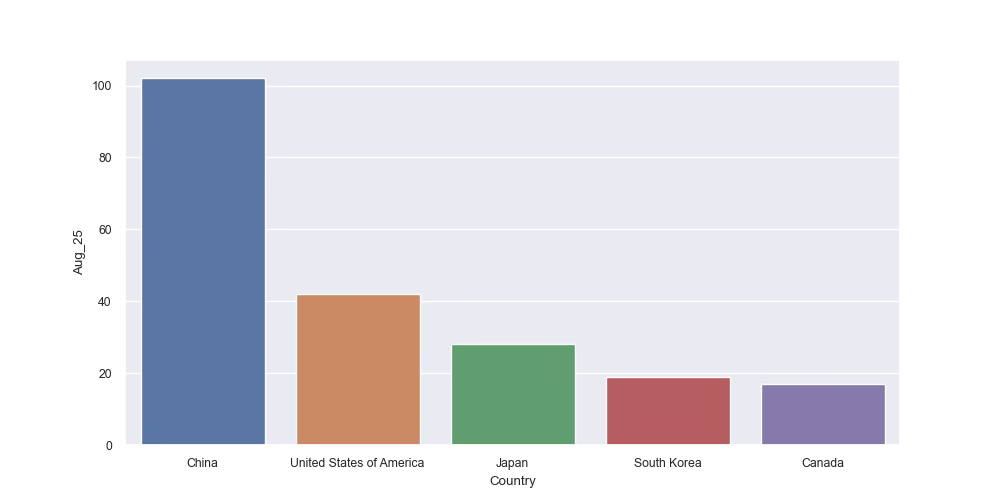
China leads the world in the number of top ranked stocks on earnings momentum, valuation and price momentum. China also leads in our QARV rankings. Computers love China. Humans don’t.
China is one of the biggest asset allocation mismatches ever. 2nd biggest economy in the world, leading in all the world’s advanced technologies, trading at a big discount, trending up, and nobody owns it, or talks about it. Well, we do.
Then Japan and South Korea as 2 of the 5 best ranked countries in the world. This has been consistent every month, but why is this? Because Asia is the epicentre of the hardware trend. It’s off the chart, but Taiwan is #6, another hardware epicentre.
Canada benefits from its leadership in gold mining.
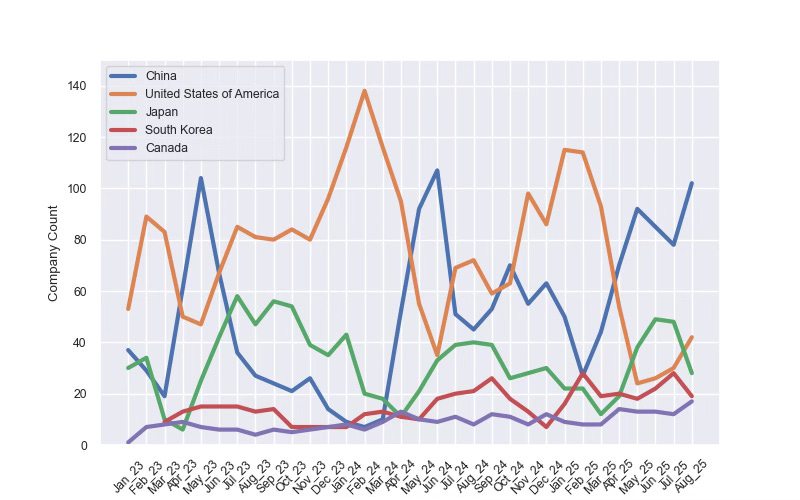
The monthly chart shows China’s improved rankings each month, while the US is struggling. The US really gets dinged with the valuation part of the ranking.
Below are links to:
the sheet with Global Factor Rankings on over 3,000 stocks.
The Tableau dashboard with the Estimate/Price Scatter chart
The Retool Data App with the useful earnings momentum charts.
So pour yourself a cuppa this weekend and let me know what you find!
Erik


