
YWR: Global Factor Model

Today’s the day. Today’s the day we review thousands of global data points to surface trends nobody is talking about.
As always the full global factor model rankings are at the bottom of the post along with our Retool Data App (with earnings estimate charts) and the Tableau Dashboard.
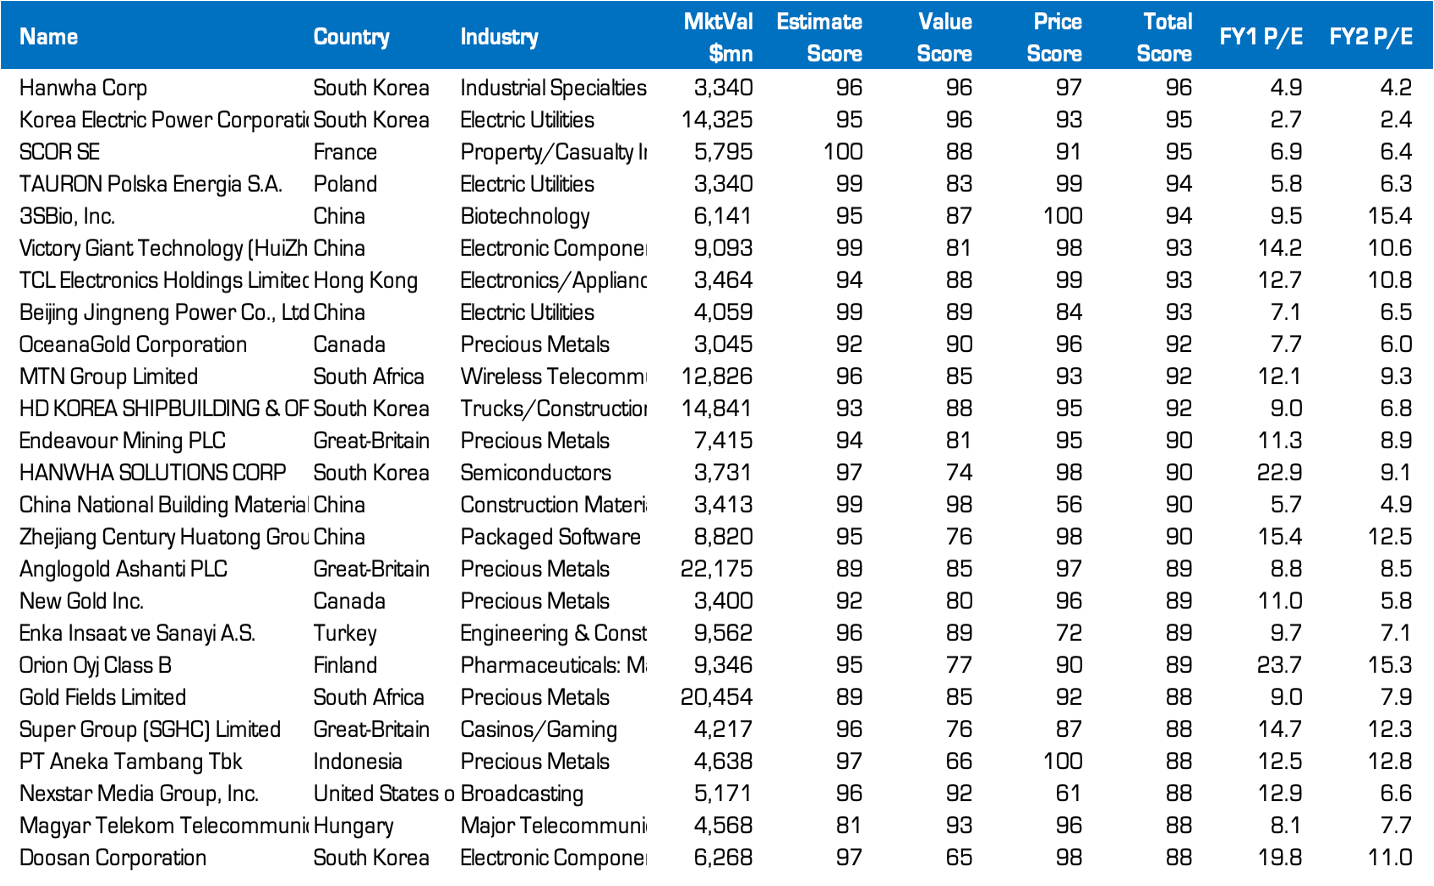
YWR Global Top 25
The Top 25 stocks in the world are not names most are familiar with. They are mid-caps from China and South Korea, Pharmaceuticals and a lot of gold miners. Well, gold miners we know.
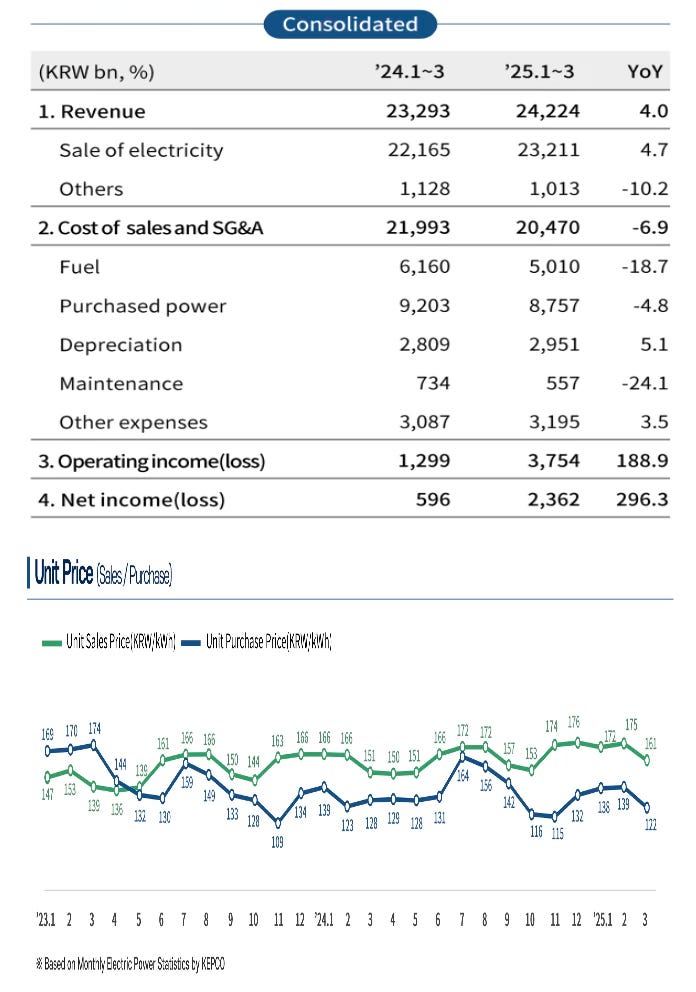
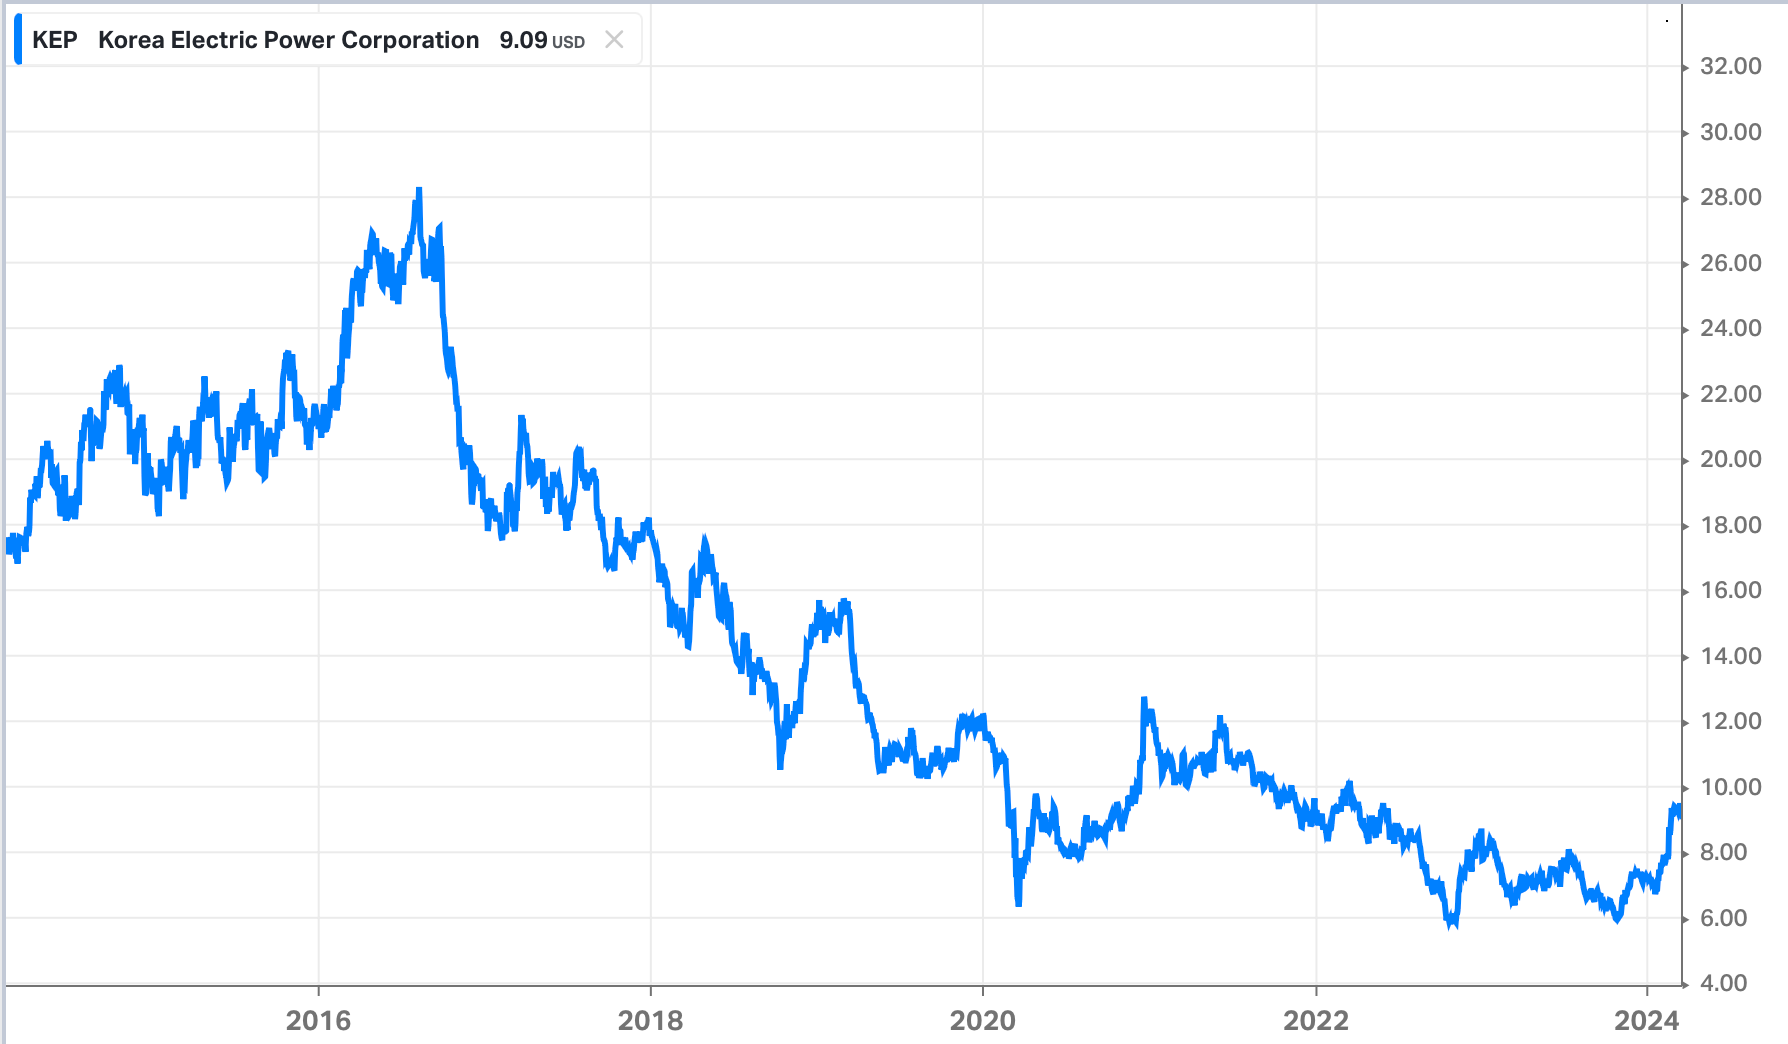
You are probably asking yourself, is KEPCO, the largest electric utility in South Korea (with an NYSE ADR:KEP) really on a P/E of 3x?
Yes, it is. On Q1 earnings annualised it will generate an EPS of KRW 13,600/share (691 million shares outstanding). With a share price of KRW 31,700 that’s a P/E of 2.3x.
The back story is revenue is +4% yoy because power prices (KRW/KWH) are +5% with demand -0.5% yoy. Meanwhile costs are down because they are using a high % of their nuclear capacity, and coal prices are low (they also have a lot of coal fired generation). So margins blow out and they are minting.
As you can see in the unit price chart above this a somewhat of an extraordinary situation, but margins probably hold up while coal prices are weak.
Investors have been concerned about KEPCO’s debt, and KEPCO had to cancel the dividend in 2023 (resumed in 2024). But if these results continue maybe the ADR goes to $15.
In case you are interested, I put KEPCO’s Q1 slides at the bottom of the post with everything else.
So KEPCO looks good, but you know what else stands out?
When I look at our Tableau dashboard (link below)…
US pipeline stocks look good.
US Pipeline MLP’s.
When you click in and look what’s driving this it’s Western Midstream, Plains All American, Energy Transfer and MPLX. They have some of the highest dividend yields in the Russell 3000 (>7%) while also having an investment grade rating, which is rare.
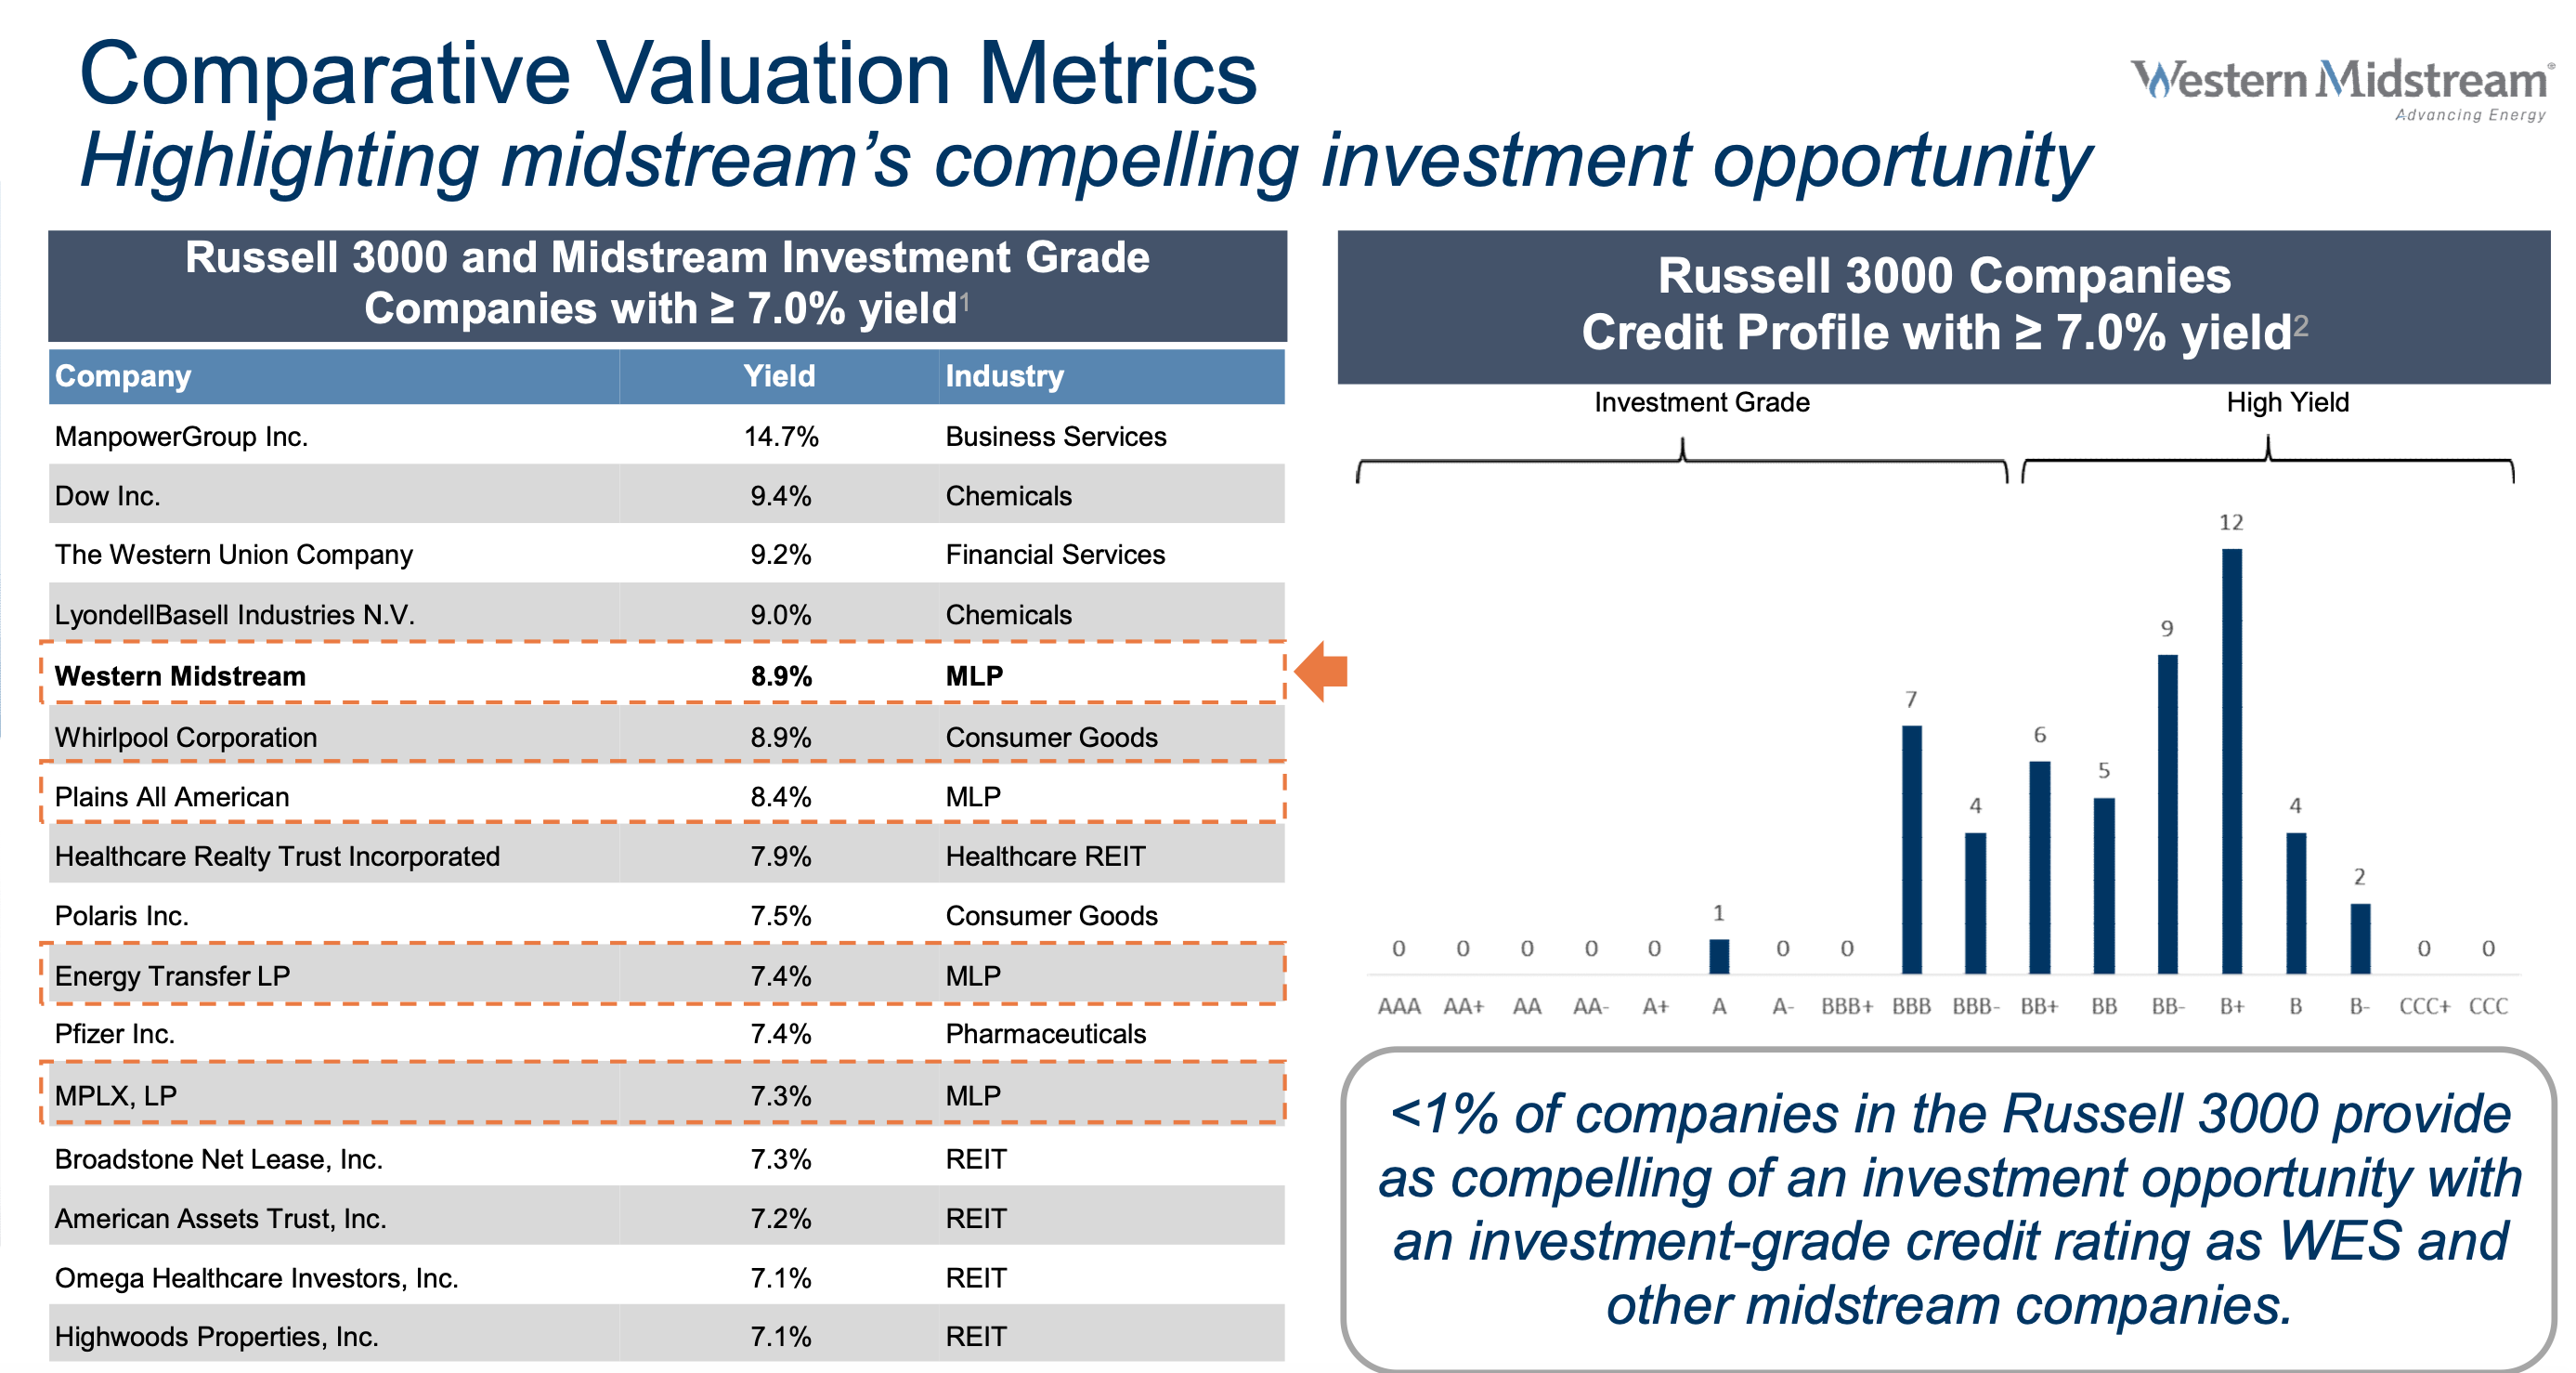
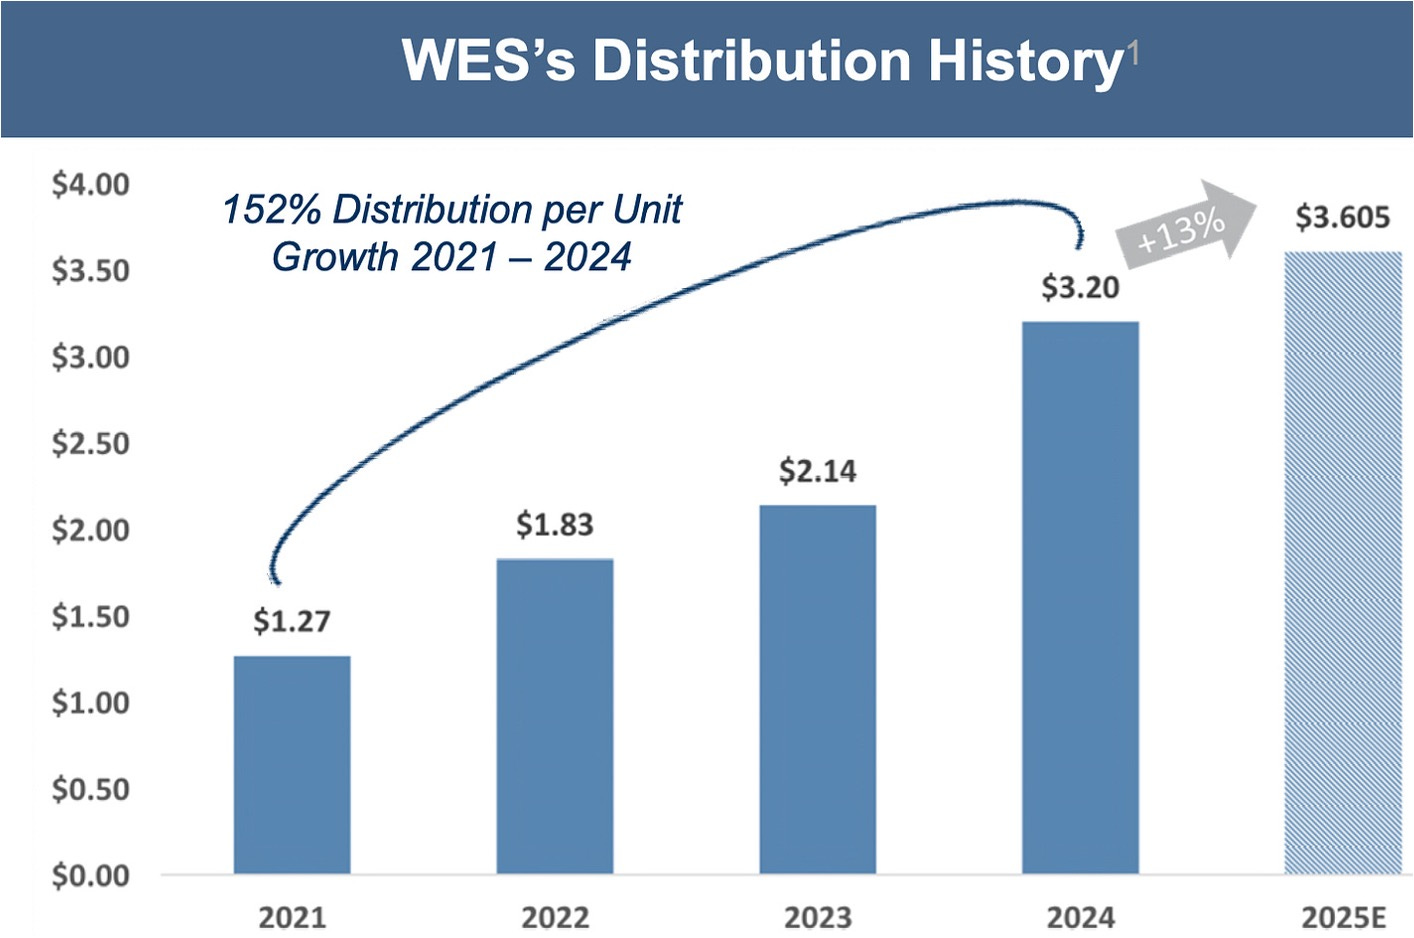
And look at the projected dividend for Western Midstream.
$3.6/share in 2025 with a share price of $38 (>9% dividend yield).
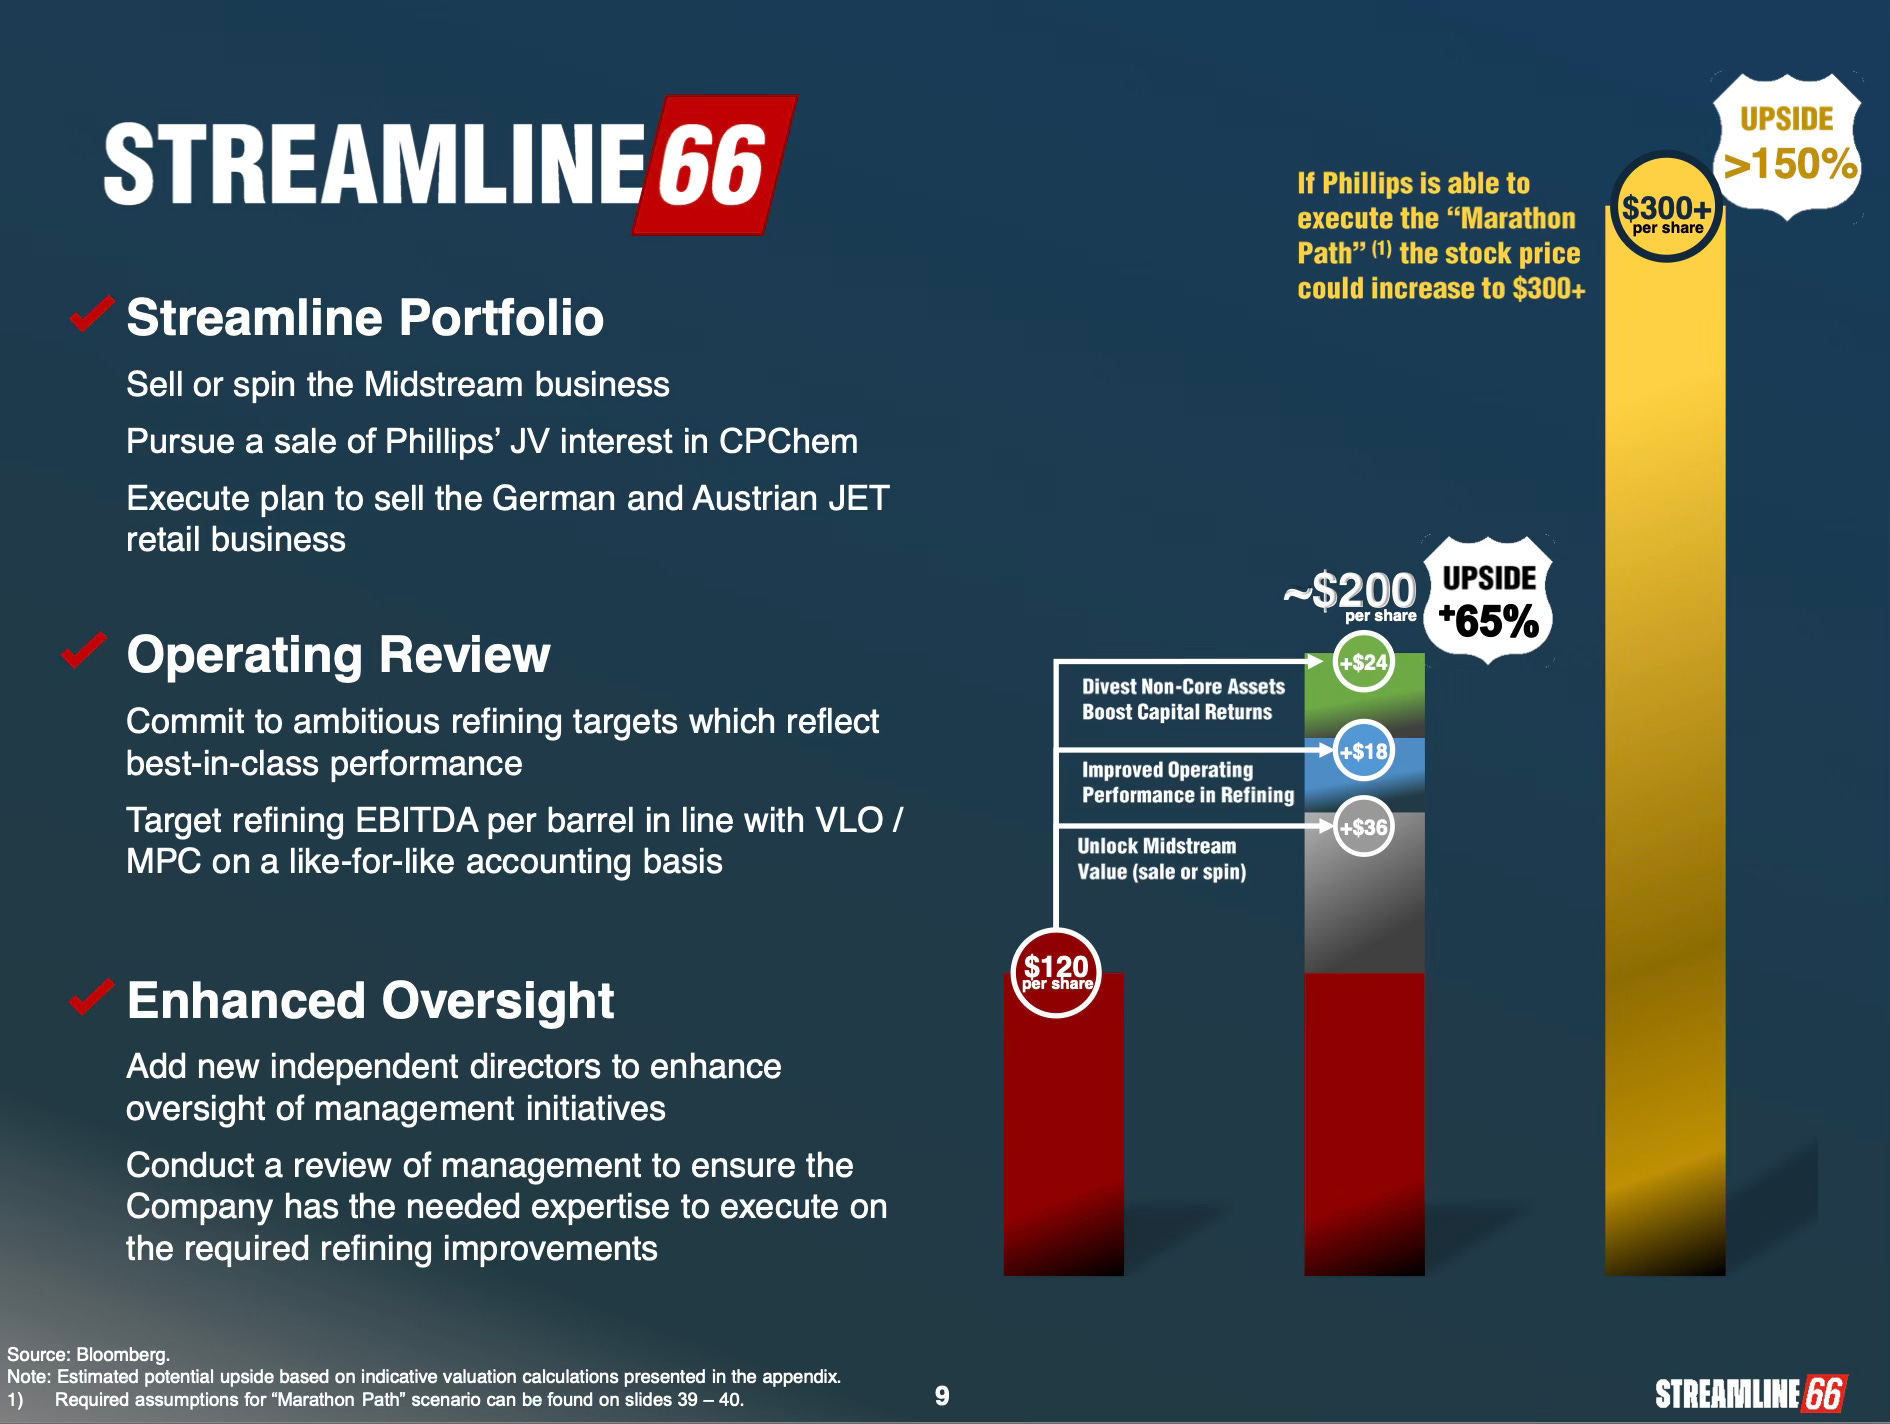
This reminds me of another pipeline play, although an indirect one; Phillips 66 ($PSX). Elliot Advisors is pressuring PSX to spin the pipeline business out to shareholders. Elliot is pitching that PSX could be worth $200/share. Note, the results of the proxy fight are out and it was a split. Elliot got 2 directors and PSX got 2, so it’s not clear how this will play out and whether the spin out will happen. But the value is still there.
I put the full Streamline 66 presentation down at the bottom along with the global rankings, the dashboards, KEPCO, and Western Midstream.
Sector Rankings
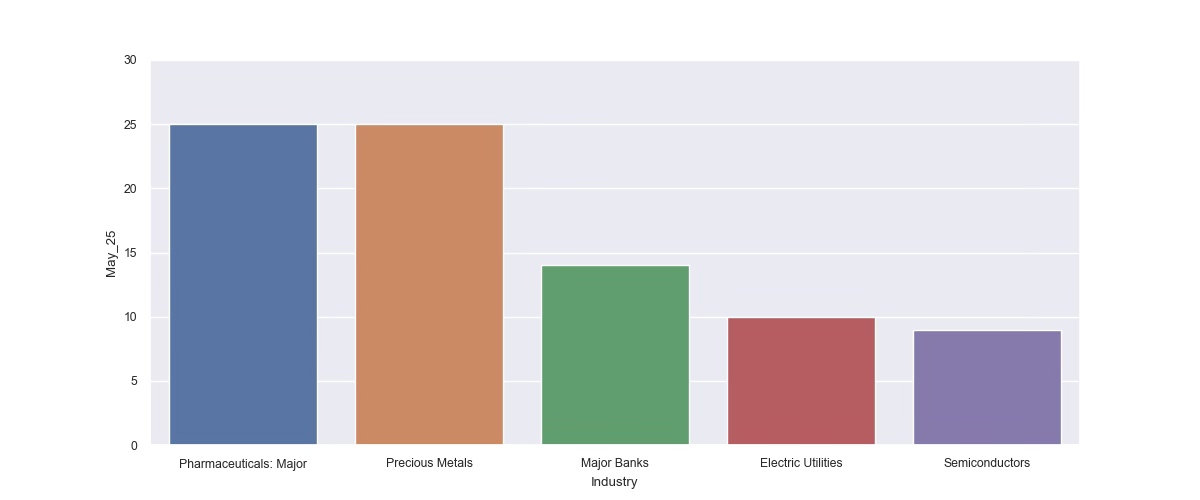
Pharmaceuticals is the top ranked sector in the world and no one knows why. We reviewed this mystery last month in Factor Model Mystery and think it has to do with changes in the out-of-pocket expense for Medicare and Medicaid in 2025 that were part of the Inflation Reduction Act in 2022.
Precious metals is #2. No surprise there.
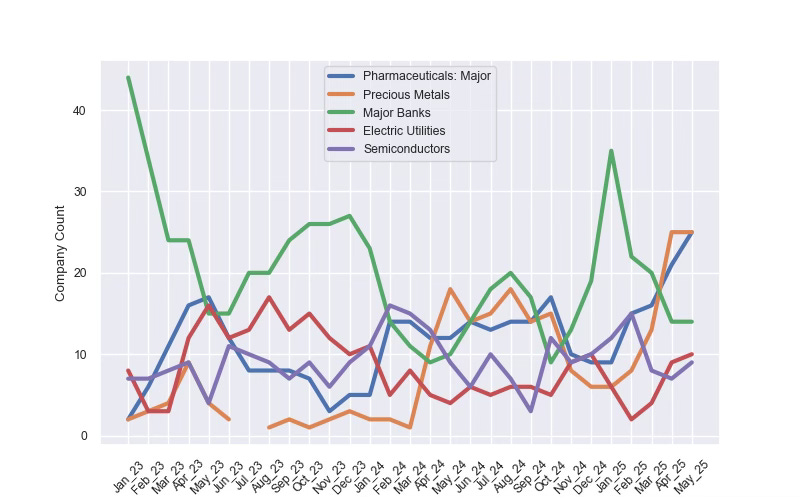
Then Banks, Utilities and Semiconductors. The semiconductor stocks are a lot of smaller suppliers in Korea, China, Japan and Taiwan. I encourage you to use the Retool data app and filter by industry to see the names.
But the more interesting question is what is going on with utilities? Look at these estimate revision charts for AES, Enel in Italy, boring National Grid in the UK, and Iberdrola in Spain. And we also had KEPCO earlier.


When we look at the monthly trends we see the continued strength of mid-cap Pharmaceuticals and Precious Metals.
Interesting that these are two sectors which the big funds don’t own.
Country Rankings
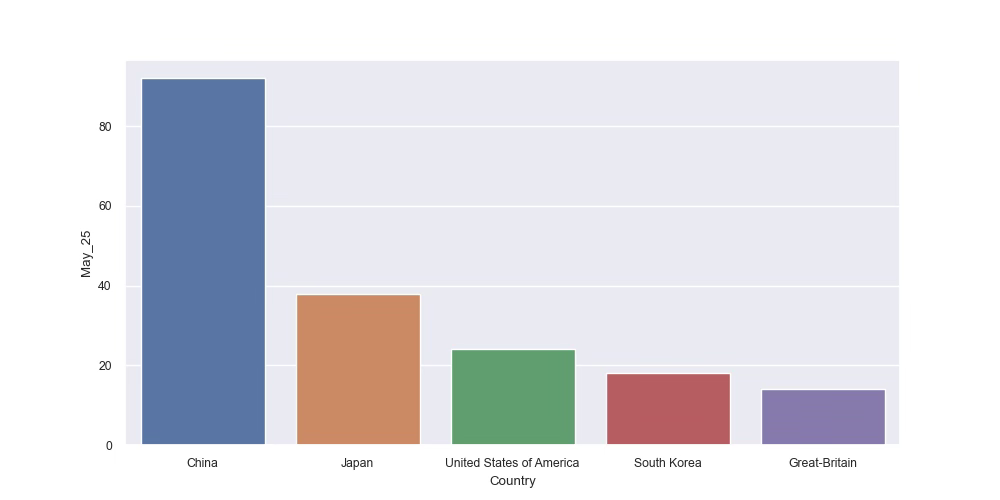
The top 5 rankings are kind of what we’ve been expecting. The data says China is the top ranked country in the world. It has the best combination of estimate revision momentum, valuations and price momentum.
Then Japan. After last week’s Global Boom charts I increasingly think we might be underestimating this market.
South Korea… this is a great one.
Then look at the sleepy, old UK in #5. It also surprised us in the Global Boom charts and is another market nobody owns.
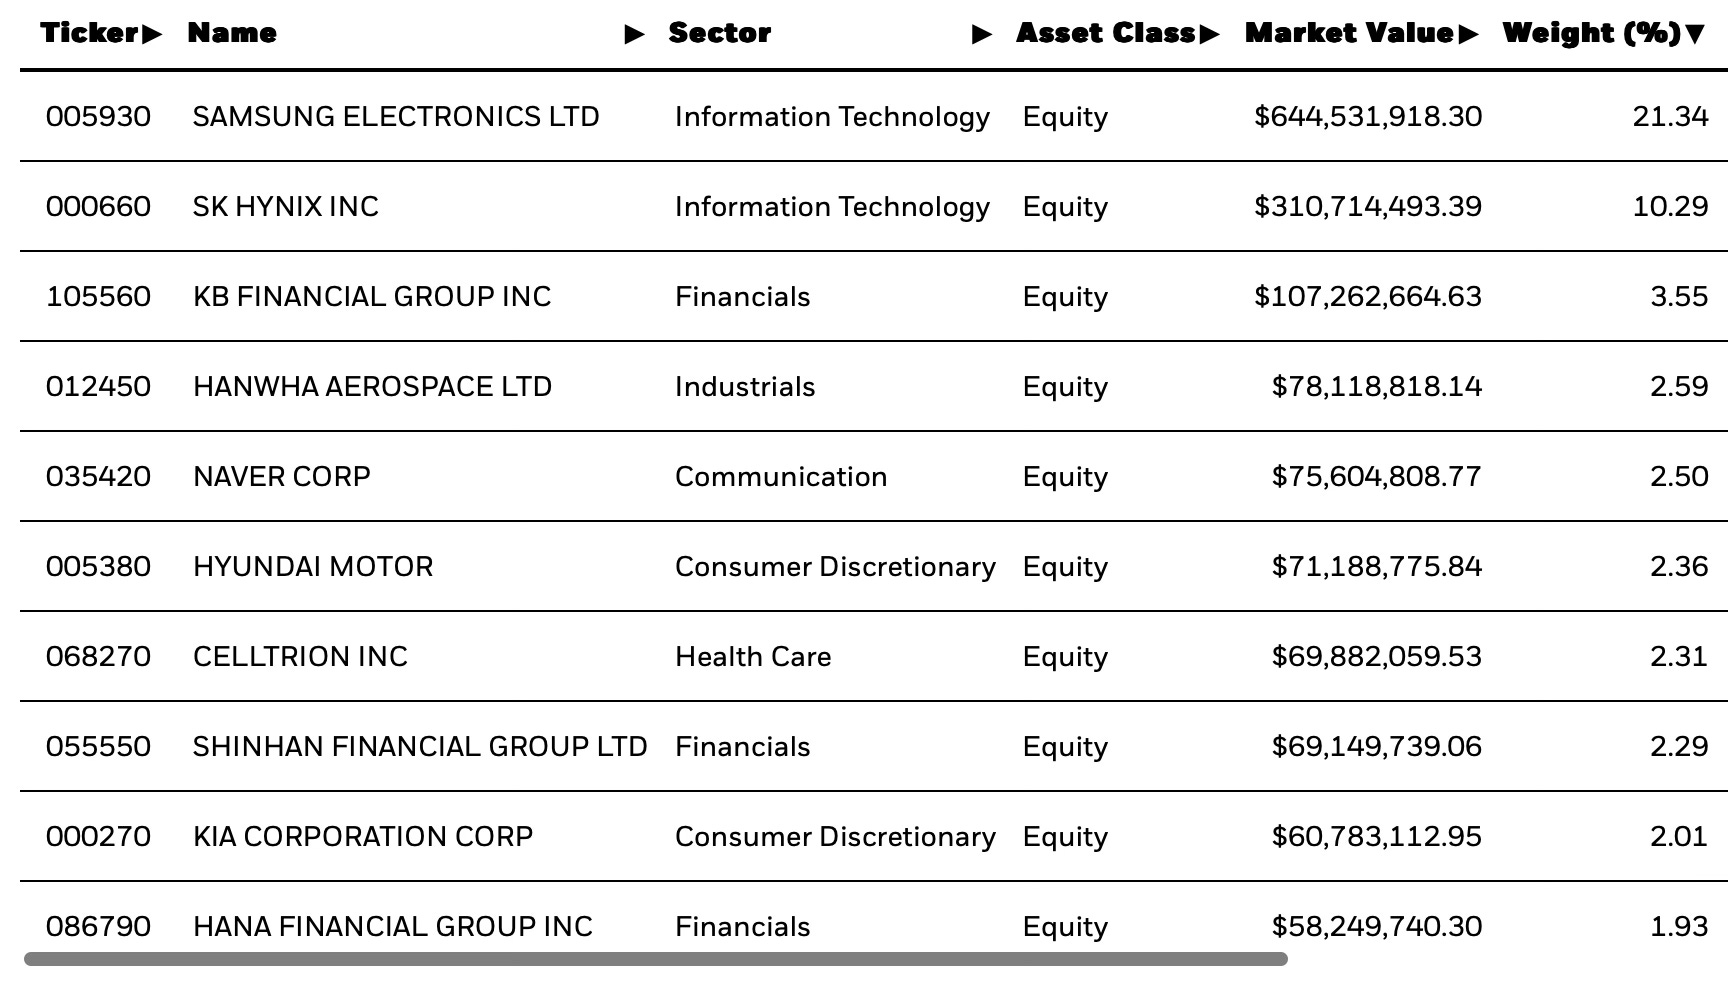
Just a reminder of what’s in the ishare Korea ETF ($EWY). Samsung at a 21% weighting is actually down from 23% back in December.
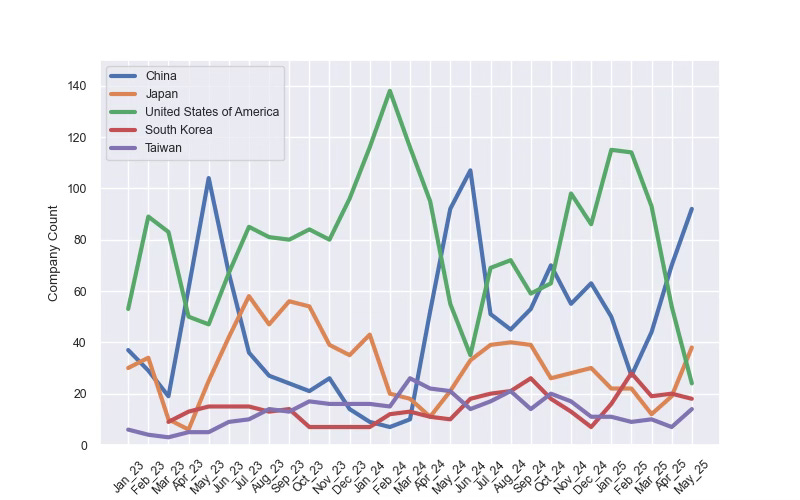
On the monthly trends chart below you see the US has lost a lot of momentum while China and Japan are moving up the ranks.
So those are my highlights, but grab a coffee and tell me what stands out to you.
Below are links to all your resources:
The Global Factor Model rankings for over 3,000 stocks
Tableau Dashboard to see sector level trends as well as stocks with good earnings momentum which haven’t moved yet.
The Retool Data app with useful estimate revision charts.
Company presentations for KEPCO, Western Midstream and Phillips 66.
