
YWR: Global Factor Model

We always know the trends nobody is talking about.
But why is that?
It’s because we have the Global Factor Model. It alerts us to early changes in earnings estimate momentum across 3,000 stocks globally. We know the news, before it’s news.
As usual the full data set and the associated Tableau Dashboard are at the bottom of the post, or on the Factor Model & QARV tab at www.ywr.world.
YWR Global Top 30
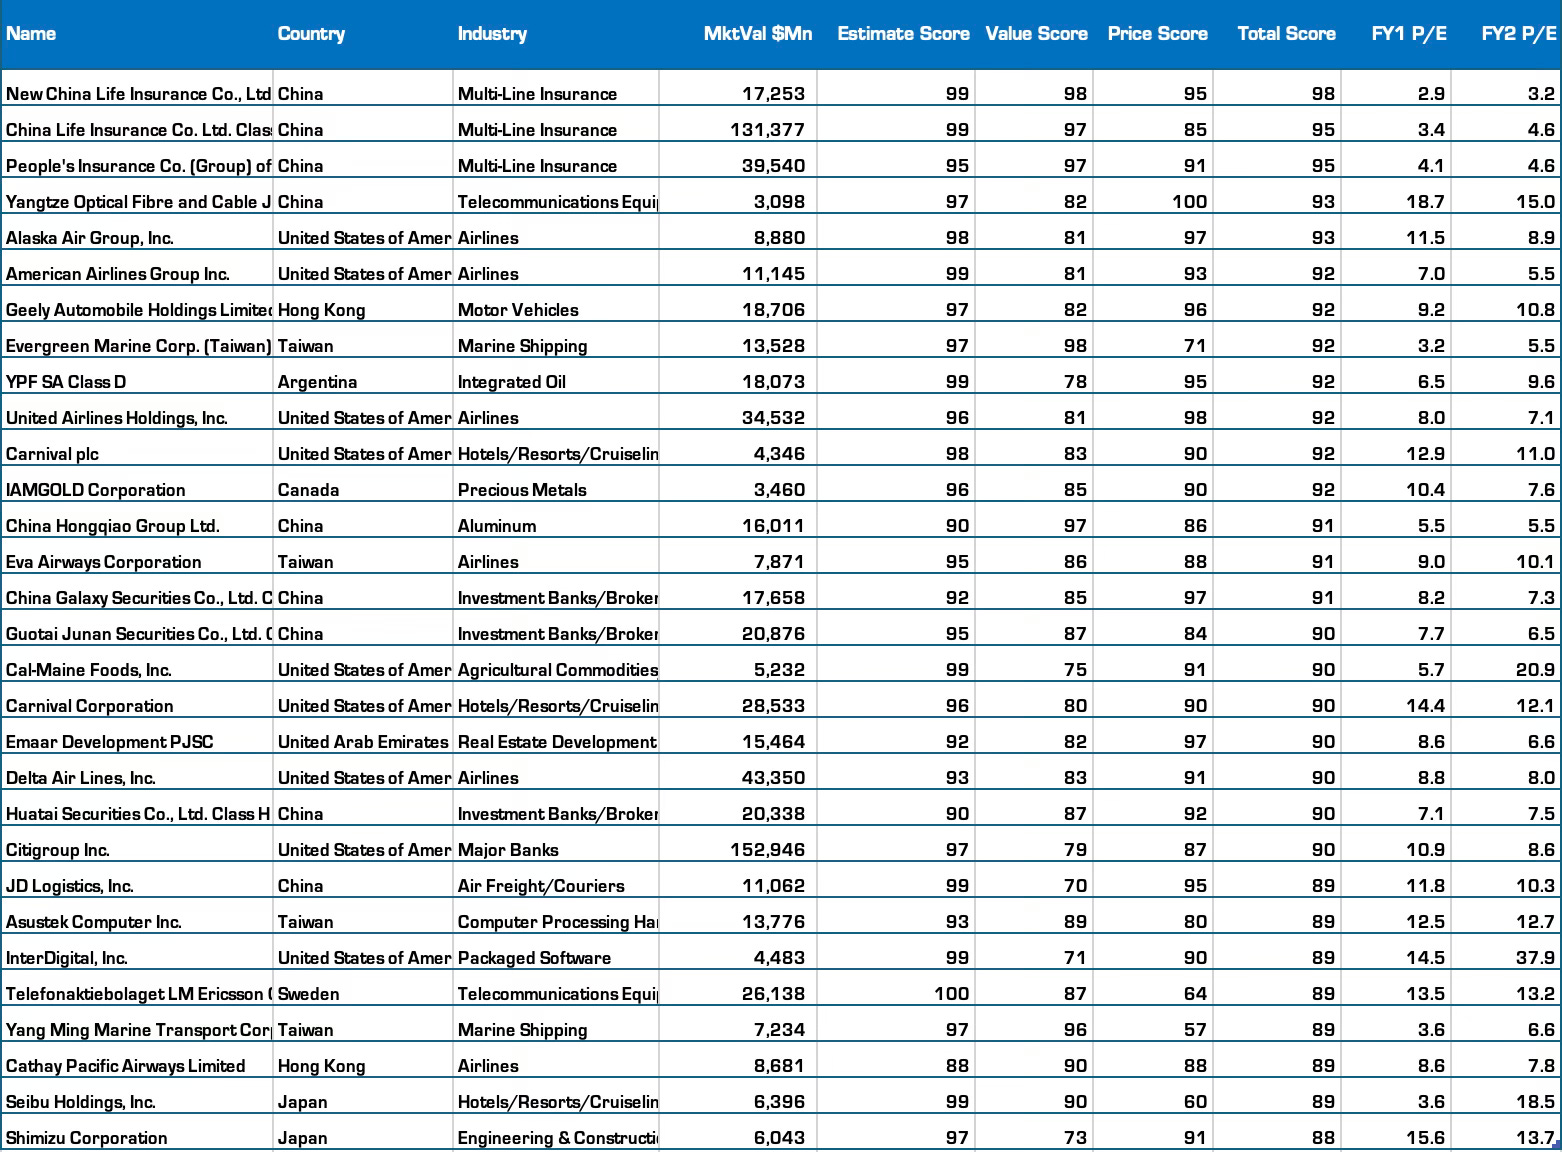
Chinese Insurance: I know you don’t care, but the model loves Chinese insurers on P/E’s of 3-5x.
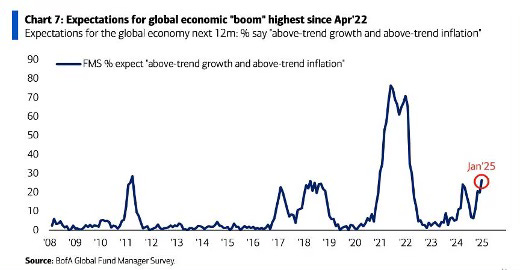
Global Boom Trades: Are we in the midst of a Global Boom (Killer Charts)? The Factor Model is way ahead of us. Shipping and Airlines are two super cyclical sectors screening well.
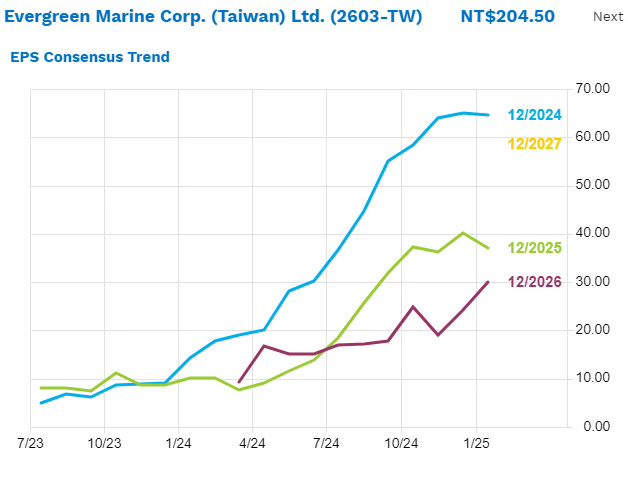
Evergreen Marine: Analysts think 2024 earnings are peak and expect a big drop in 2025 (65/share drops to 38/share). 2024 benefitted from Houthis and pre-tariff ordering, but have you noticed how these events keep happening? What’s the story? Even if analysts are correct about 2025, Evergreen is still on less than 6x earnings. Evergreen also scores will in the latest QARV model with an average ROE of 45% for the last 5 years and no debt.
Airlines: Airline earnings estimate have been on an uptrend for several months and it makes sense. Production problems at Airbus and Boeing are a fantastic constraint for the sector. It should be good for the aircraft leasing companies as well like AerCap.
Airbus had been “unable fully to capitalise on Boeing’s weakness because of the supply chain issues”, adding that this was “clearly a big lost opportunity”. “That’s the rub,” he continued, noting the effect in particular on Airbus’s top-selling A321neo. “Airbus can’t manufacture them fast enough,” he said of the narrow-body jet. “Airbus has come out of Covid with more problems than they probably acknowledge and the operational task of turning it around is very significant.” Source: FT
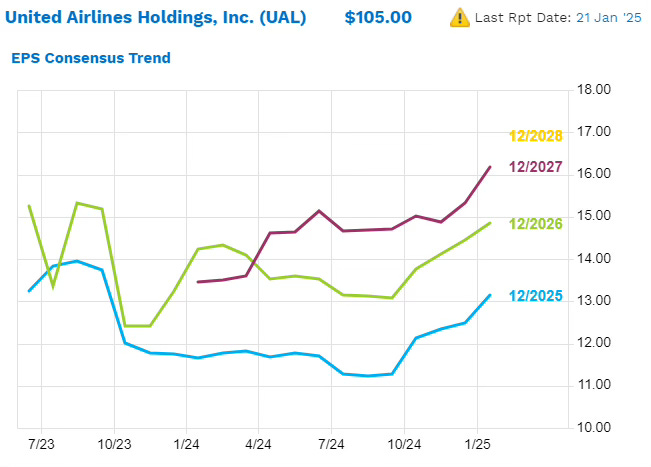
American Airlines, United and Delta are on 2025 P/E’s of 5-8x. The bull case is the next few years will be the most profitable period EVER for airlines, but investors don’t trust it.
What if we get to the end of 2025 and investors figure out the airline cycle is longer than we think and price United at 10x a 2026 EPS of $15?
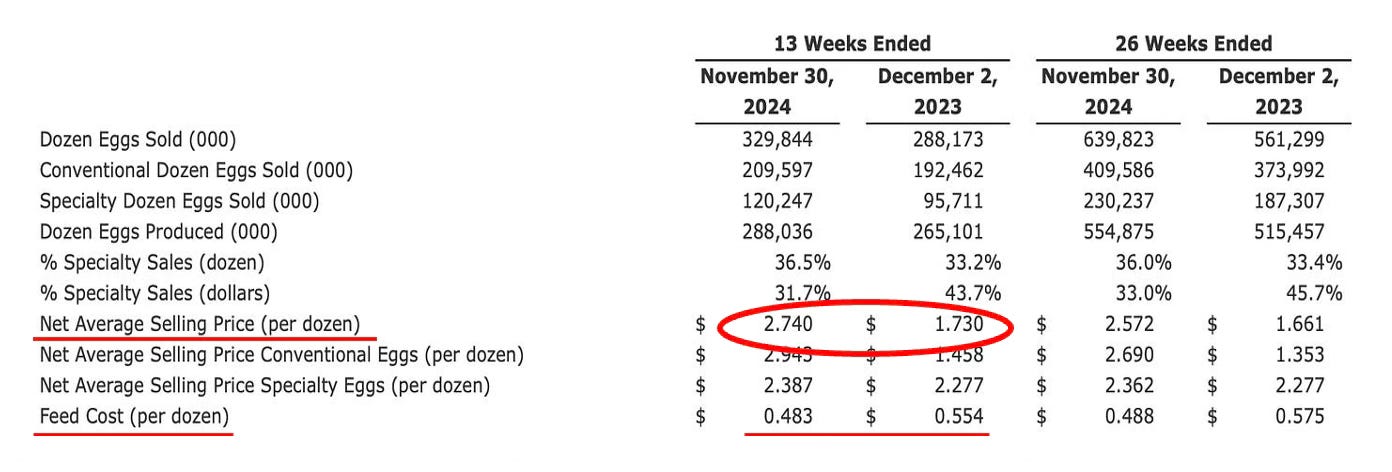
Cal-Maine: the egg business is kind of amazing right now. Earnings estimates are exploding higher. Egg prices are +58% while feed cost are flat to down. It’s a similar story with beef. These datapoints support the YWR view that inflation will inflect higher.

Trading Opportunities
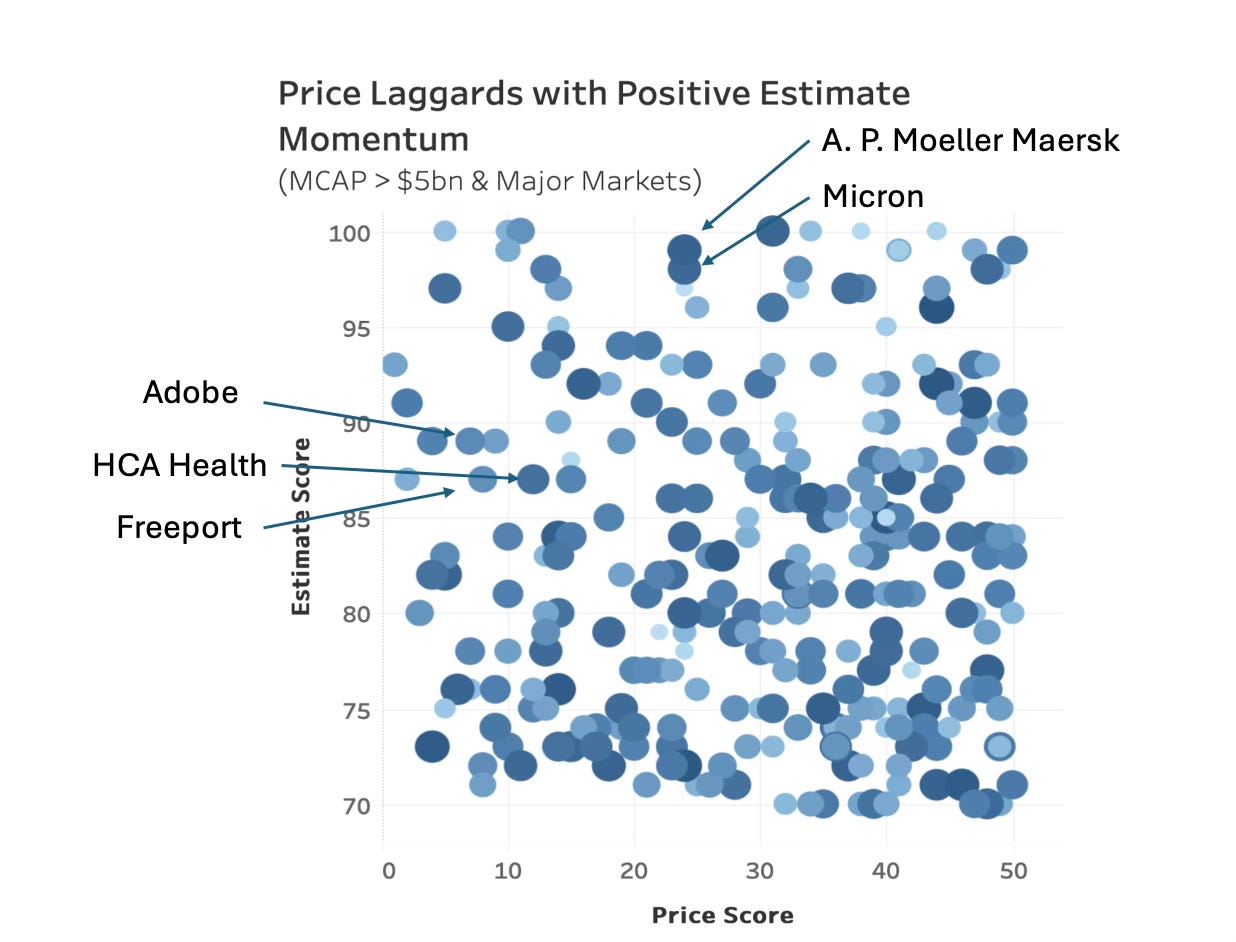
I created a useful tool in the Tableau dashboard to find trading ideas using the Factor Model. This interactive scatterplot is the combination of companies with high estimate scores (estimate score 70-100), but which haven’t moved much (price score of 0-50). In Tableau when you hover over each dot it reveals the company name. I labeled a few examples.
Top 5 Sectors
Banks are scoring particularly well and have been for years. Insurance is a hidden gem. The industry is benefitting from both higher premiums and higher investment income on fixed income portfolios. Airlines make the top 5 which is rare.

In Major Banks Citigroup, Capital One, Wells Fargo and Standard Chartered all score well. But it’s also Major banks in Japan, Thailand and Israel. Then also surprisingly, regional banks in the US. Check it out for yourself in the data.
In Mult-Line Insurance Ping An scores highly and will be a go-to name as the China market gets going. Lincoln National scores well in the US on a P/E of 4x. In the Tableau Dashboard for estimate momentum by sector Specialty Insurance is the top ranked sub-sector.
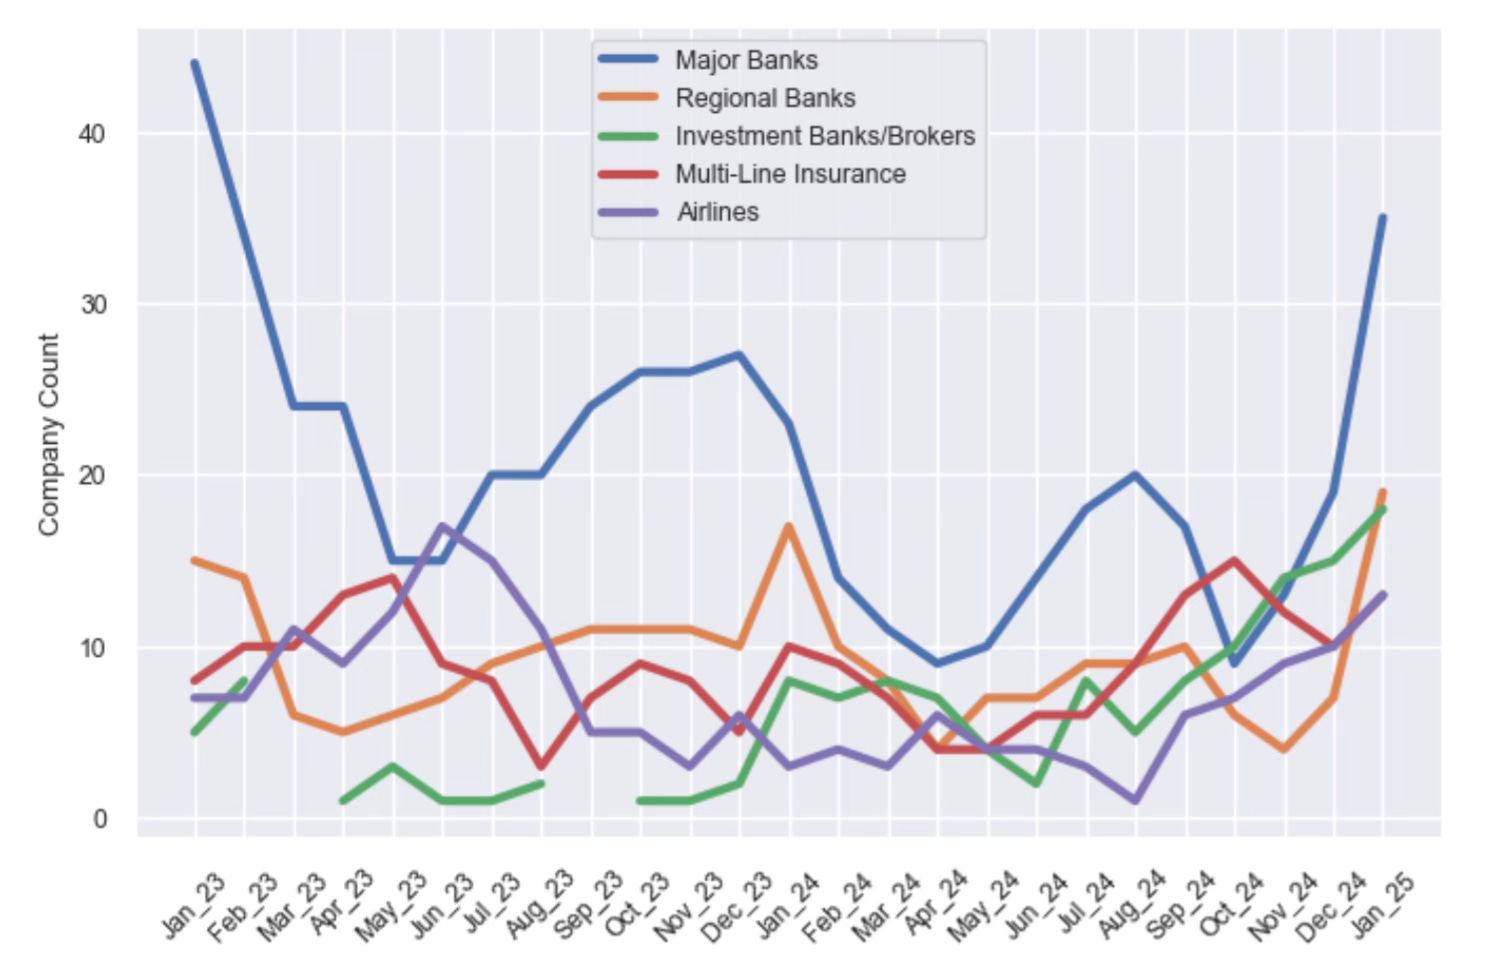
Top 5 Sectors Historical Monthly Trend
Is it supportive of the global-boom thesis that banks have so much momentum globally?
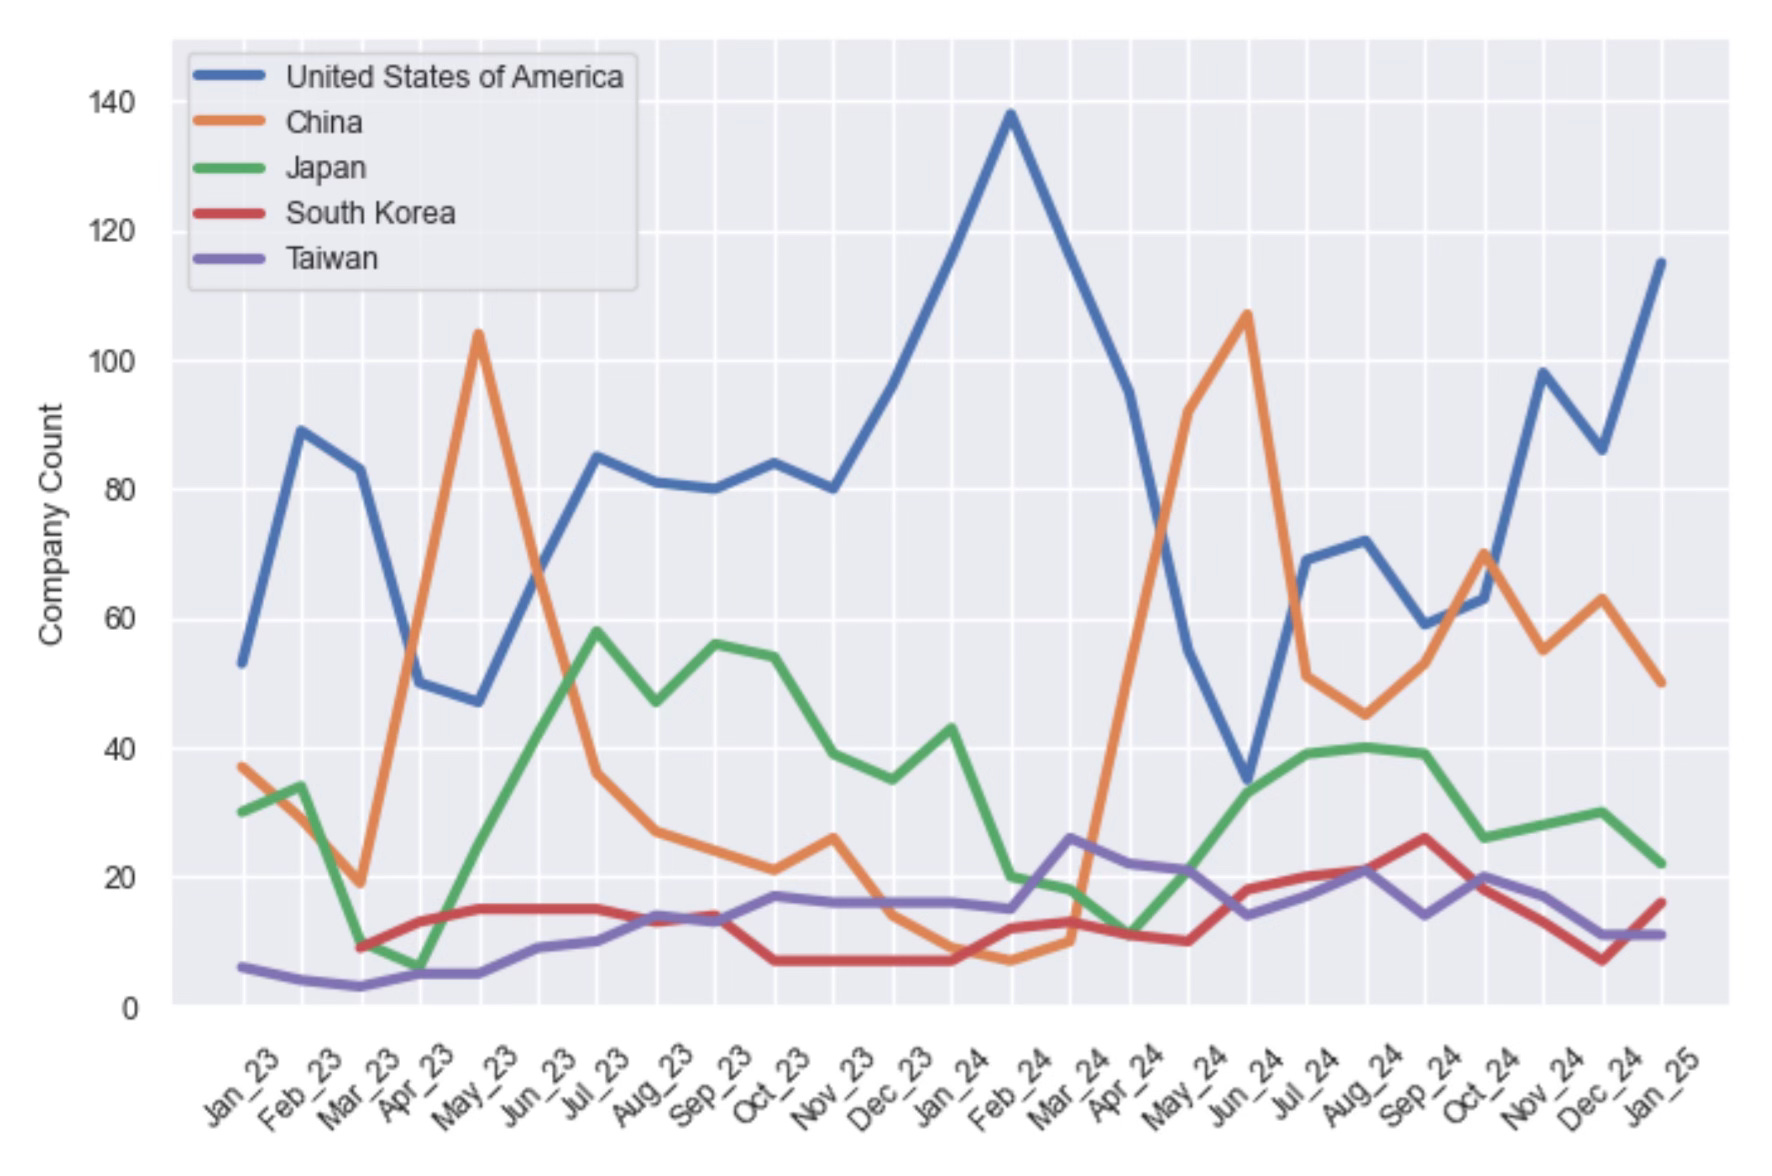
Top 5 Countries
The number of US companies in the top 300 ranked stocks is near all time highs. When I look at ‘why?’ it’s the all the US Major Banks, Regional Banks and Investment Banking stocks scoring well.
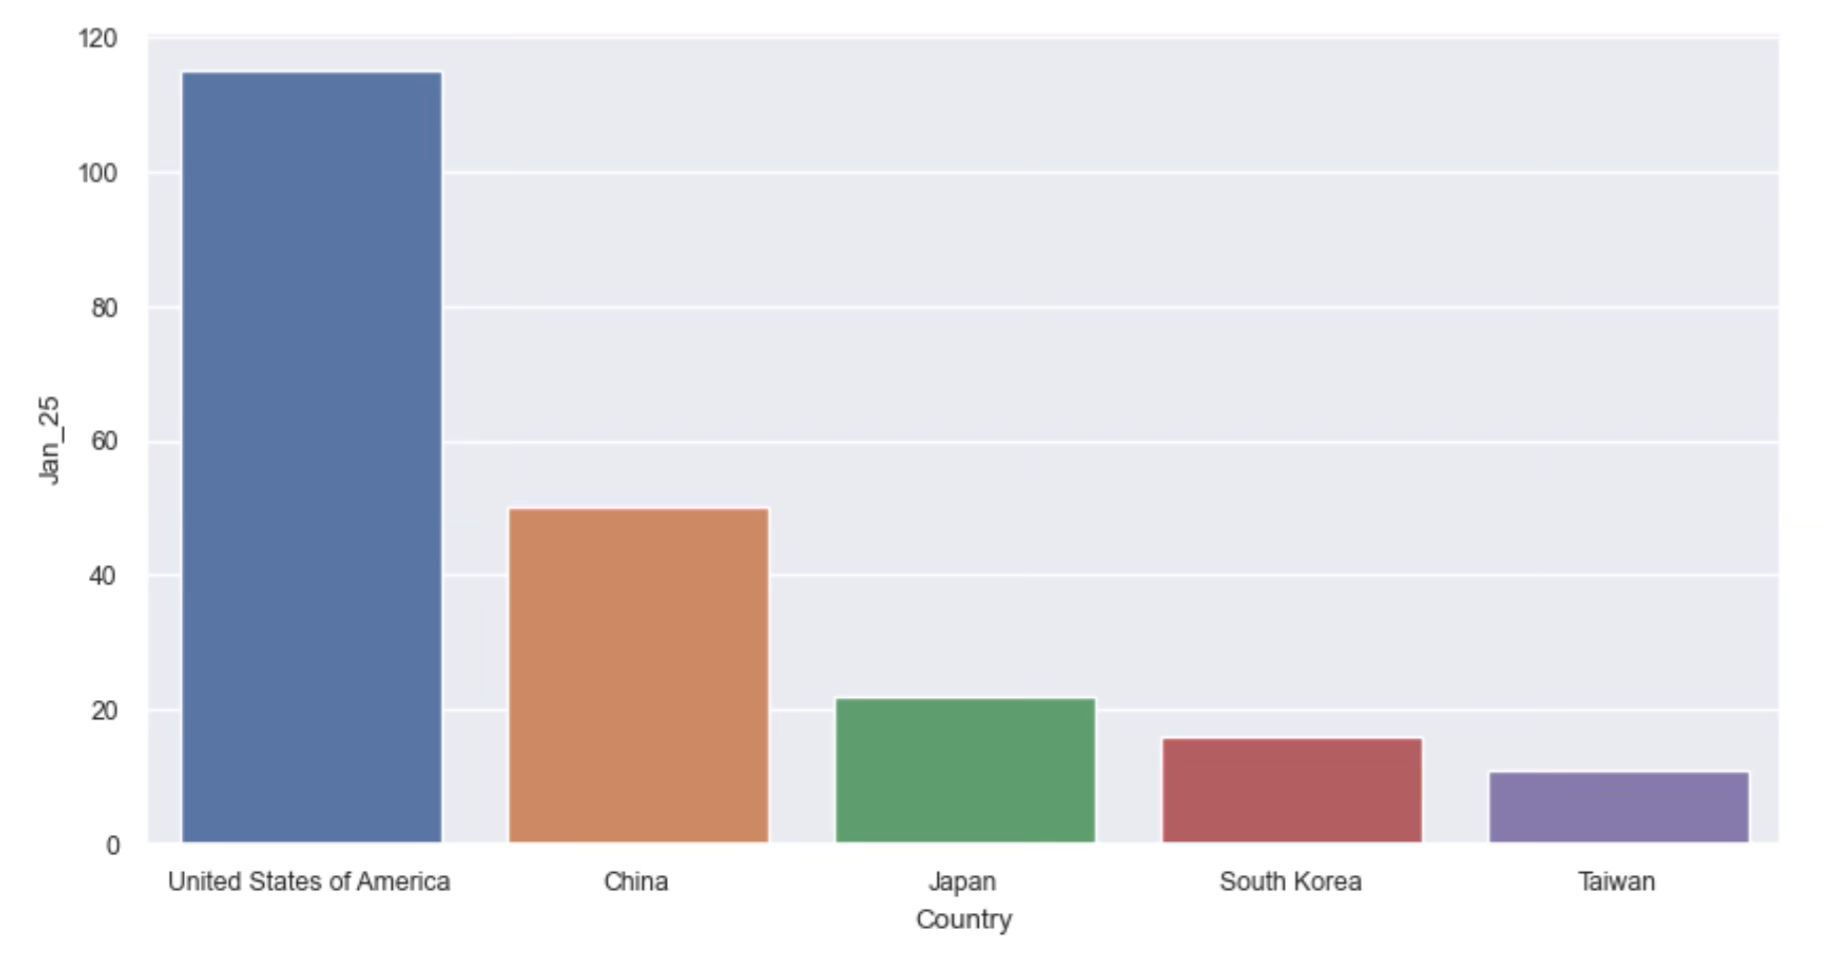
Outside of the US we see a consistent pattern month over month of China, Japan, South Korea and Taiwan scoring well. We call this the New Europe. We bought the South Korea ETF at the end of 2024 (Who am I ETF?).
Below are links to the January Factor model scores for over 3,000 stocks plus the Tableau Dashboard to click around interactively:
