
YWR: The Bull Market in US Gas.


It’s so exciting all these multi-billion VC investments in AI and data centers.
$6 bn into Grok
$1.3bn in Estruxture data centers.
$1.1bn into Coreweave
$6bn into Vantage Data Centers
$850mn into Echelon Data Centers
All in just the last 6 months:

Goldman estimates $1 trillion will be invested in AI and datacenters.
It’s too bad we can’t get in on these deals.
But maybe it’s OK.
Sometimes life gives you what you need, not what you want.
Data Center Power Demand
The tidal wave of money into AI and data centers is creating unexpected growth in US power demand.

This power demand growth is expected to continue through 2030. The other interesting thing is that 60% of this incremental power demand is expected to be fueled by gas.
Gas fueled electricity is more consistent and better for inferencing. Apparently.
Overall, AI data centers could add 3.3 bcf/day to US gas consumption. We’ll come back to the significance of that.
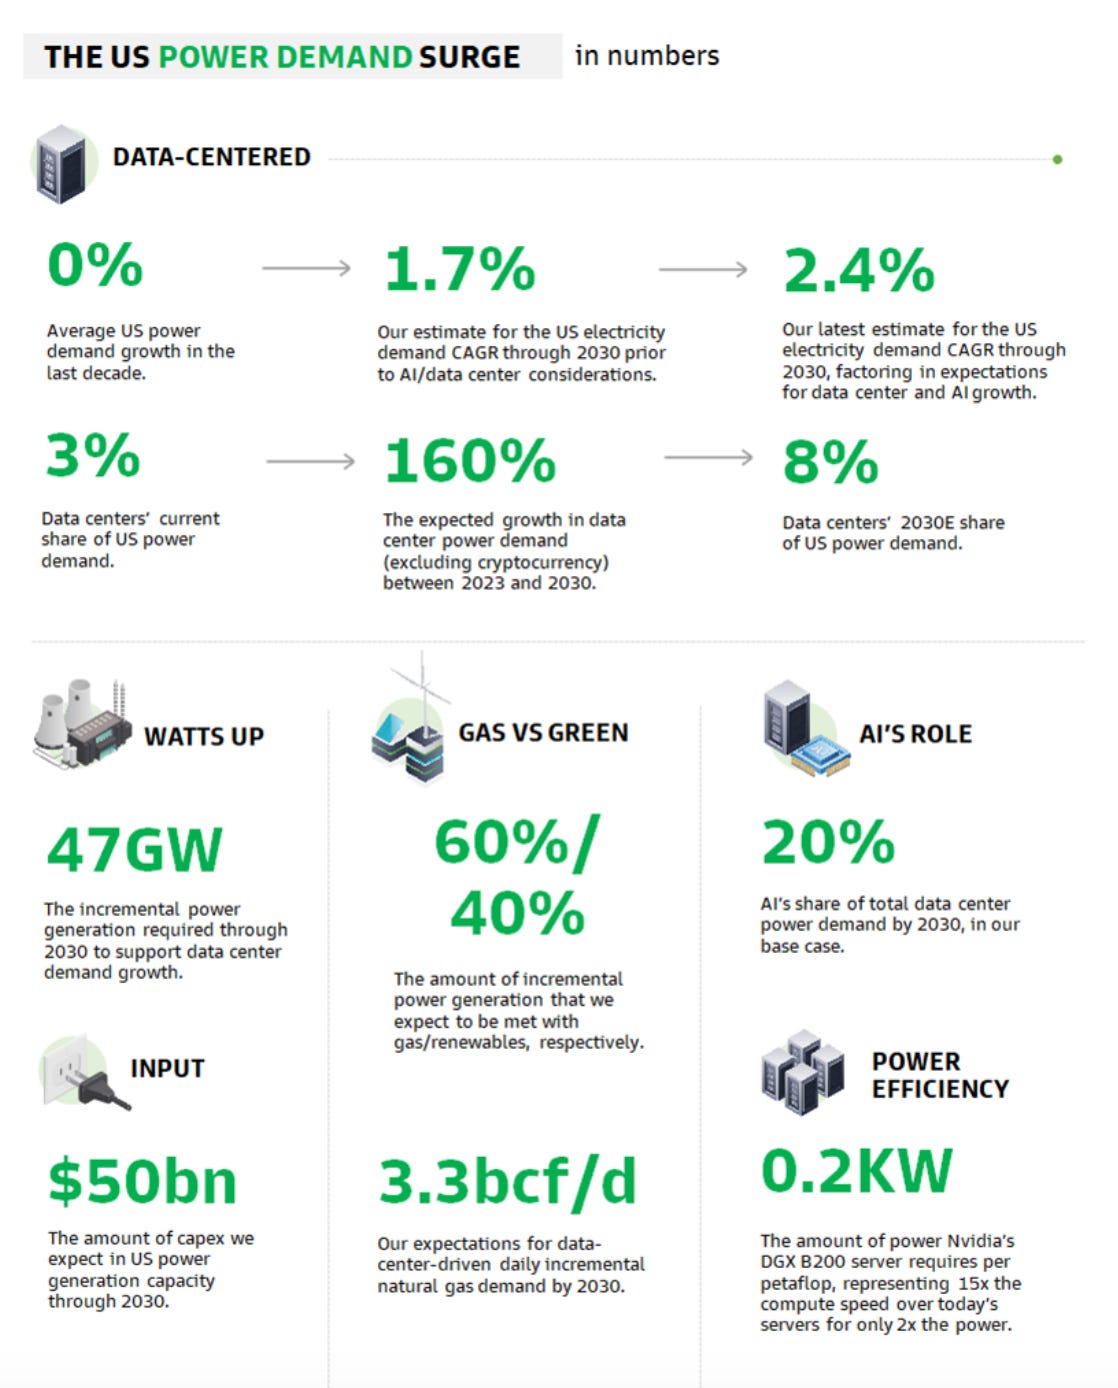
Between AI data centers and baseline electricity growth, Goldman estimates US gas demand will grow at a 3% CAGR through 2030.

Gas demand growth - base vs data centers (2020-2030E)
14,000
12,000
10,000
8,000
6,000
4,000
2,000
(2,000) O
(4,000)
(6,000)
Base Annual Gas Growth
n
Data Center Annual Gas Growth")
Wasn’t gas supposed to be dying out?
Apparently not.
Rising demand meets falling supply
It’s kind of been assumed that US gas is a cheap and plentiful fuel where we just a few more rigs whenever we need more supply.
We don’t even think about it anymore.
Our problem since 2000 has been more gas then we know what to do with. The US produces over 100 bcf/day of gas. Remember the 100 #.

But there are signs we might be at an inflection point in this gas story and nobody is paying attention.
Rigs drilling for oil and gas in the US are down sharply. From over 2000 back in 2014,to roughly 900. The rig count crashed after the first oil shock in 2015-2016 and never came back.

This is a big drop, but nobody seems to care about the rig count any more. The new normal is that the number of rigs doesn’t matter for production.
It turns our US energy companies are surprisingly efficient at drilling for US gas. It turns out we can grow supply with half the number of rigs, even though we used to think US shale gas deposits depleted quickly and required constant drilling.
Here is how the relationship of US gas production and the total US rig count looks over the long-term.

It’s a bit messy, but what do you see?
From 1990 - 2000 rigs and gas production were both flattish. Gas production was 50 bcf/day.
Then starting in 2002 the number of rigs grew 70% to 1,750 in 2007. There was a pause for the GFC, but then the # of rigs climbed again to over 2,200 in 2013.
It took a while, but with a 4 year lag gas production (green line) started to grow in 2006. It started to grow and never stopped.
Gas production has been a consistent trend up and to the right and now the US produces over 100 bcf/day of gas.
But look at the trend in rigs… where does that suggest we are going longer term with gas production? Gas production with this number of rigs used to be 60 bfc/not 100.
Is there a lagged effect to the downside coming? The same way it worked to the upside?
When you look at US gas supply forecasts, it’s assumed US gas and oil production from shale will keep growing out to 2030 despite the declining rig count. The chart below is US oil output. I haven’t been able to find an outlook for US gas supply, but my guess is it looks similar to the chart below.

But lets get a bit micro and zoom in on the month to month of US gas production.
Am I seeing things, or is is starting to trend slightly negative? Maybe we need to see a few more months to be sure.
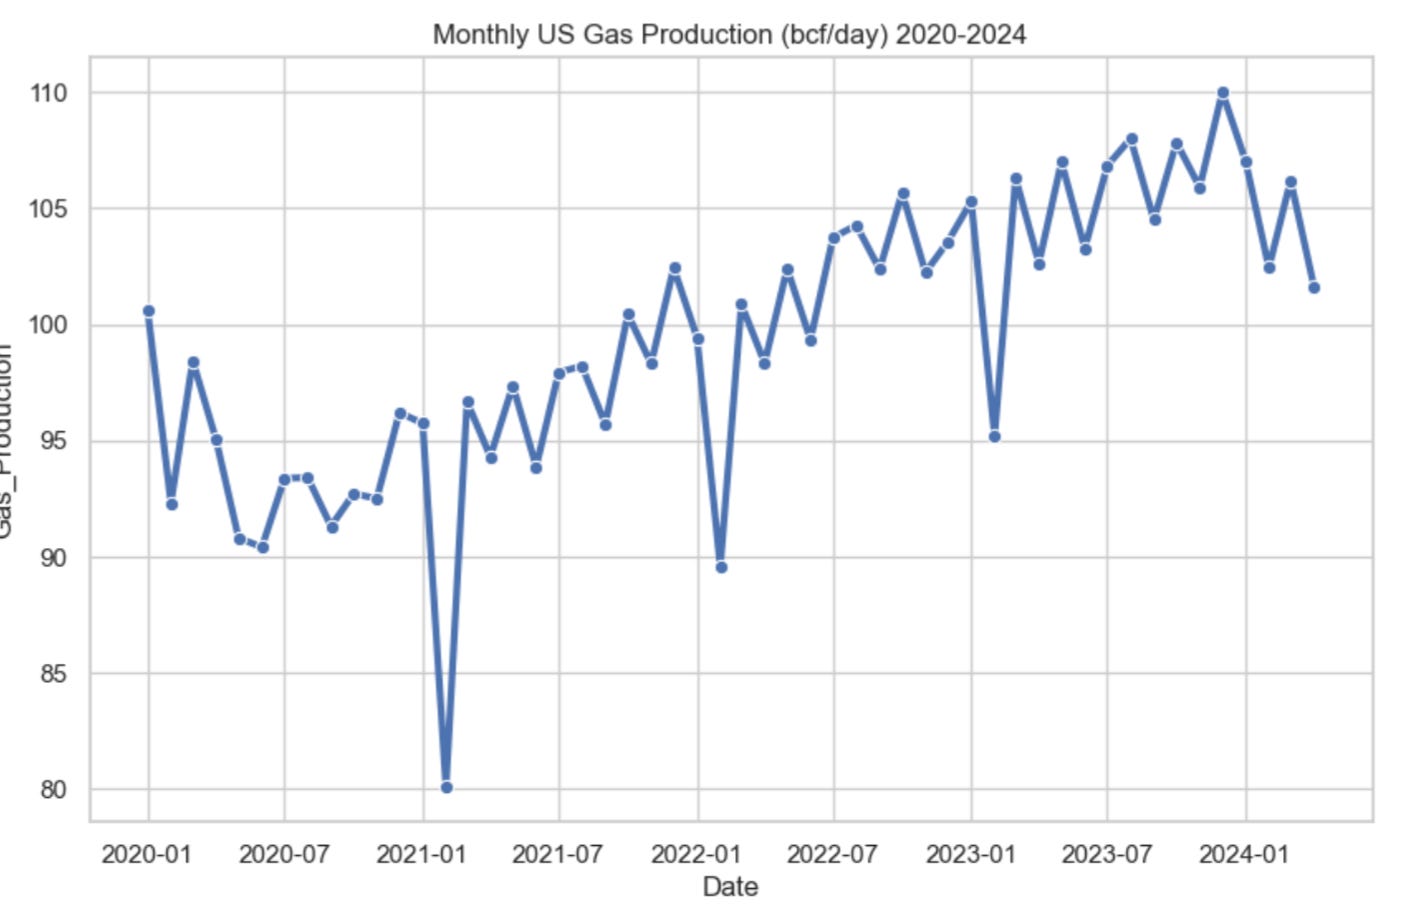
It makes sense that we should start to see US gas production declining after this long a period of a sub 1000 rig count.
And efficiency can cut both ways. US rigs can get more efficient, while the fields can become depleted.
The Liquifaction Cherry on Top
So let’s add it up.
We potentially have gas demand growth of 2-3% annually from economic growth and AI data centers.
This is all theoretical so let’s use a conservative assumption of 0.5 bcf/year of incremental gas demand and no baseline economic growth. Let’s assume that gets eaten up by solar and wind.

Meanwhile, we might be in the midst of a multi-year decline in gas supply. Could gas production fall to 90 bcf/day (-10 bcf?).
But wait it gets better.
Do you remember the LNG liquifaction boom?
I know it was years ago, but do you remember the investment trend to build LNG liquifaction terminals? The idea was to take US gas at $2.50 and sell it at $12-14.
Well those terminals are being completed. 10bcf/day of liquifaction capacity is complete with another 6 bcf/day to be completed by 2028. These are projects approved and under construction.

So that’s potentially another 6 bcf/day of demand coming from the export market on top of the 3 bcf/day going to the data centers.
Yes, we don’t know how many solar and wind farms get built, but maybe we are being to critical of gas in all of our assumptions.
All the solar and wind farms get built, the gas supply remains high despite the drop in the rig count, the LNG terminals get delayed or aren’t allowed to export, etc.
You can never know all the variables, but it looks like good risk reward to say $2.50 gas could be the low point.
